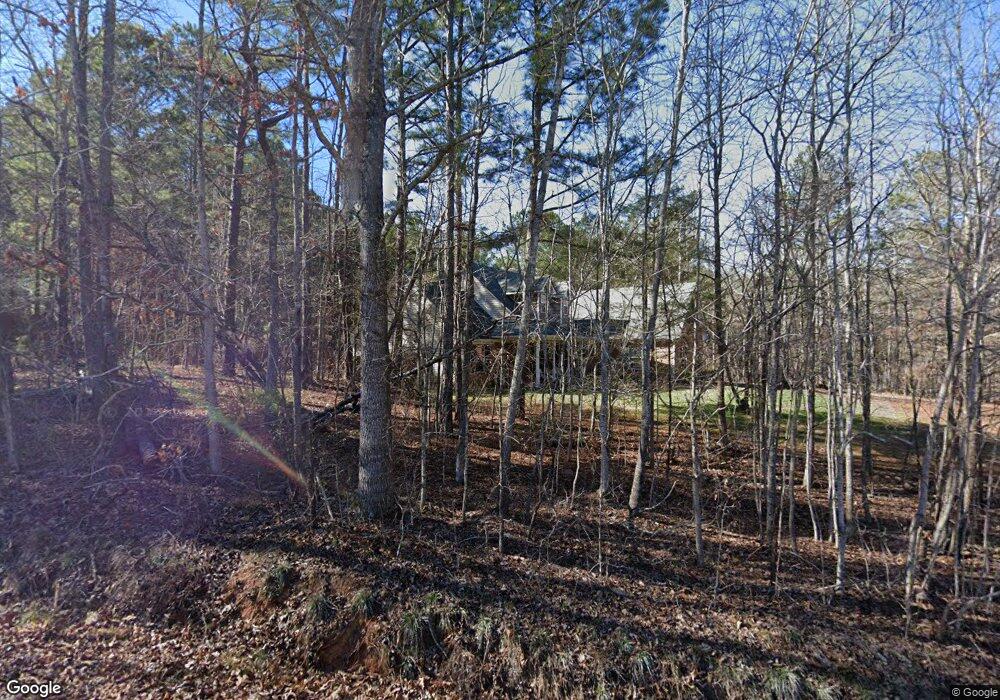
220 Cedar Rd Covington, GA 30016
Estimated Value: $327,184 - $356,000
--
Bed
3
Baths
2,102
Sq Ft
$164/Sq Ft
Est. Value
About This Home
This home is located at 220 Cedar Rd, Covington, GA 30016 and is currently estimated at $343,796, approximately $163 per square foot. 220 Cedar Rd is a home located in Newton County with nearby schools including Livingston Elementary School, Liberty Middle School, and Alcovy High School.
Ownership History
Date
Name
Owned For
Owner Type
Purchase Details
Closed on
Aug 3, 2011
Sold by
Thompson Ashley Ann
Bought by
Thompson Christopher Lee
Current Estimated Value
Purchase Details
Closed on
Dec 11, 2006
Sold by
Jlm Dev Llc
Bought by
Thompson Christopher L and Thompson Ashley A
Home Financials for this Owner
Home Financials are based on the most recent Mortgage that was taken out on this home.
Original Mortgage
$199,721
Interest Rate
6.31%
Mortgage Type
FHA
Create a Home Valuation Report for This Property
The Home Valuation Report is an in-depth analysis detailing your home's value as well as a comparison with similar homes in the area
Home Values in the Area
Average Home Value in this Area
Purchase History
| Date | Buyer | Sale Price | Title Company |
|---|---|---|---|
| Thompson Christopher Lee | -- | -- | |
| Thompson Christopher L | $201,300 | -- |
Source: Public Records
Mortgage History
| Date | Status | Borrower | Loan Amount |
|---|---|---|---|
| Previous Owner | Thompson Christopher L | $199,721 |
Source: Public Records
Tax History Compared to Growth
Tax History
| Year | Tax Paid | Tax Assessment Tax Assessment Total Assessment is a certain percentage of the fair market value that is determined by local assessors to be the total taxable value of land and additions on the property. | Land | Improvement |
|---|---|---|---|---|
| 2024 | $3,698 | $149,840 | $7,000 | $142,840 |
| 2023 | $3,487 | $132,360 | $7,000 | $125,360 |
| 2022 | $2,872 | $109,720 | $7,000 | $102,720 |
| 2021 | $2,612 | $90,000 | $7,000 | $83,000 |
| 2020 | $2,304 | $72,480 | $7,200 | $65,280 |
| 2019 | $2,229 | $69,240 | $7,200 | $62,040 |
| 2018 | $2,153 | $66,600 | $7,200 | $59,400 |
| 2017 | $1,844 | $57,600 | $5,400 | $52,200 |
| 2016 | $1,645 | $51,800 | $5,400 | $46,400 |
| 2015 | $1,529 | $48,440 | $5,400 | $43,040 |
| 2014 | $1,490 | $47,400 | $0 | $0 |
Source: Public Records
Map
Nearby Homes
- 25 Castlehill Ct
- 105 Highgrove Dr
- 85 Lakeside Dr
- 75 Oak Hill Dr
- 145 Wynfield Way
- 0 Roseberry Rd
- 70 Cowan Ridge
- 0 Tempie Ln
- 102 Tempie Ln
- 40 Belmont Cir Unit 2
- 400 Oak Hill Dr
- 5798 Salem Rd
- 910 Georgia 162
- 110 Twin Lakes Dr
- 265 Lazy Hollow Ln
- 60 Knights Cir
- 55 Twin Lakes Dr
- 205 Woodcrest Dr
- 165 Wildcat Creek Dr
- 195 Twin Lakes Dr