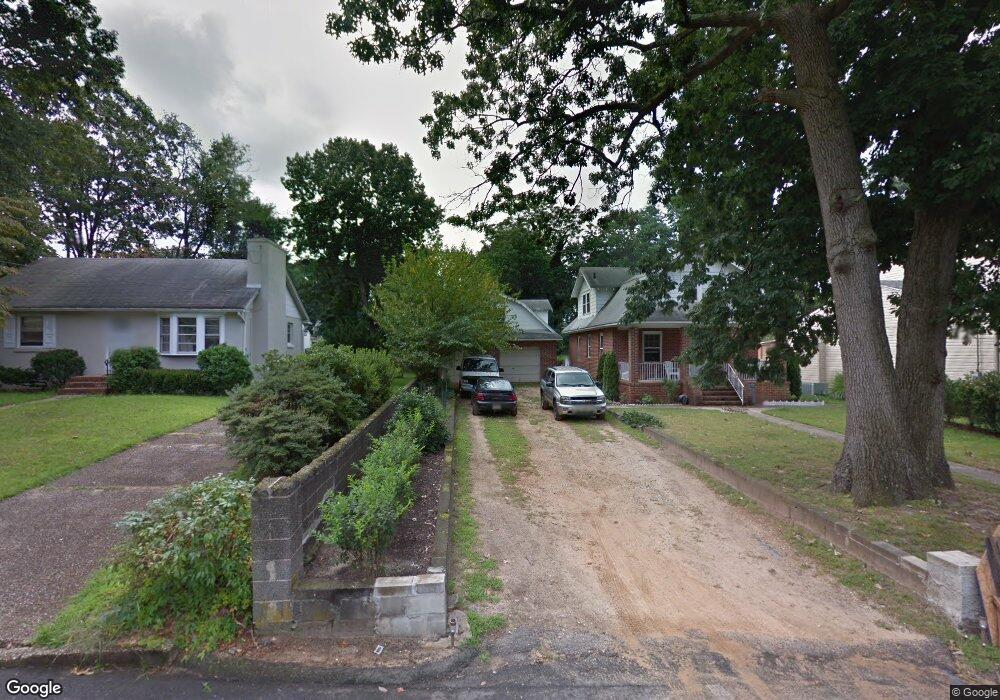
220 Chestnut St Runnemede, NJ 08078
Estimated Value: $277,000 - $338,000
--
Bed
--
Bath
1,456
Sq Ft
$209/Sq Ft
Est. Value
About This Home
This home is located at 220 Chestnut St, Runnemede, NJ 08078 and is currently estimated at $304,581, approximately $209 per square foot. 220 Chestnut St is a home located in Camden County with nearby schools including Mary E. Volz Elementary School, Downing Elementary School, and Triton High School.
Ownership History
Date
Name
Owned For
Owner Type
Purchase Details
Closed on
Nov 14, 2021
Sold by
Strable Jr Raymond G
Bought by
Foster Kimberly and Foster Raymond
Current Estimated Value
Purchase Details
Closed on
Aug 13, 2015
Sold by
Sellers Karen
Bought by
Strable Raymond G
Purchase Details
Closed on
Aug 9, 2001
Sold by
Estate Of Richard B Gaskill
Bought by
Strable Raymond G
Create a Home Valuation Report for This Property
The Home Valuation Report is an in-depth analysis detailing your home's value as well as a comparison with similar homes in the area
Home Values in the Area
Average Home Value in this Area
Purchase History
| Date | Buyer | Sale Price | Title Company |
|---|---|---|---|
| Foster Kimberly | -- | Odonnell Sean | |
| Foster Kimberly | -- | Odonnell Sean | |
| Strable Raymond G | -- | Attorney | |
| Strable Raymond G | $85,000 | -- |
Source: Public Records
Tax History Compared to Growth
Tax History
| Year | Tax Paid | Tax Assessment Tax Assessment Total Assessment is a certain percentage of the fair market value that is determined by local assessors to be the total taxable value of land and additions on the property. | Land | Improvement |
|---|---|---|---|---|
| 2025 | $6,083 | $135,000 | $46,900 | $88,100 |
| 2024 | $5,898 | $135,000 | $46,900 | $88,100 |
| 2023 | $5,898 | $135,000 | $46,900 | $88,100 |
| 2022 | $5,711 | $135,000 | $46,900 | $88,100 |
| 2021 | $5,576 | $135,000 | $46,900 | $88,100 |
| 2020 | $5,520 | $135,000 | $46,900 | $88,100 |
| 2019 | $5,419 | $135,000 | $46,900 | $88,100 |
| 2018 | $5,315 | $135,000 | $46,900 | $88,100 |
| 2017 | $5,179 | $135,000 | $46,900 | $88,100 |
| 2016 | $5,114 | $135,000 | $46,900 | $88,100 |
| 2015 | $5,129 | $135,000 | $46,900 | $88,100 |
| 2014 | $5,063 | $135,000 | $46,900 | $88,100 |
Source: Public Records
Map
Nearby Homes
- 232 Garden Terrace
- 642 Central Ave
- 329 Union Ave
- 27 E 3rd Ave
- 39 E 2nd Ave
- 37 W 5th Ave
- 1042 Central Ave
- 108 Schubert Ave
- 206 W 5th Ave
- 115 W 1st Ave
- 850 Orchard Ave
- 200 Knight Ave
- 211 Broadway
- 21 S Oakland Ave
- 209 Lake Dr
- 309 Oakland Ave
- 230 E Evesham Rd Unit B-1
- 230 E Evesham Rd Unit C15
- 14 E Evesham Rd
- 524 Hirsch Ave
- 216 Chestnut St
- 228 Chestnut St
- 214 Chestnut St
- 235 Union Ave
- 234 Chestnut St
- 233 Union Ave
- 225 Union Ave
- 217 Chestnut St
- 524 Oak St
- 239 Union Ave
- 219 Union Ave
- 226 Garden Terrace
- 518 Oak St
- 206 Garden Terrace
- 220 Garden Terrace
- 241 Union Ave
- 213 Union Ave
- 202 Garden Terrace
- 244 Chestnut St
- 247 Union Ave