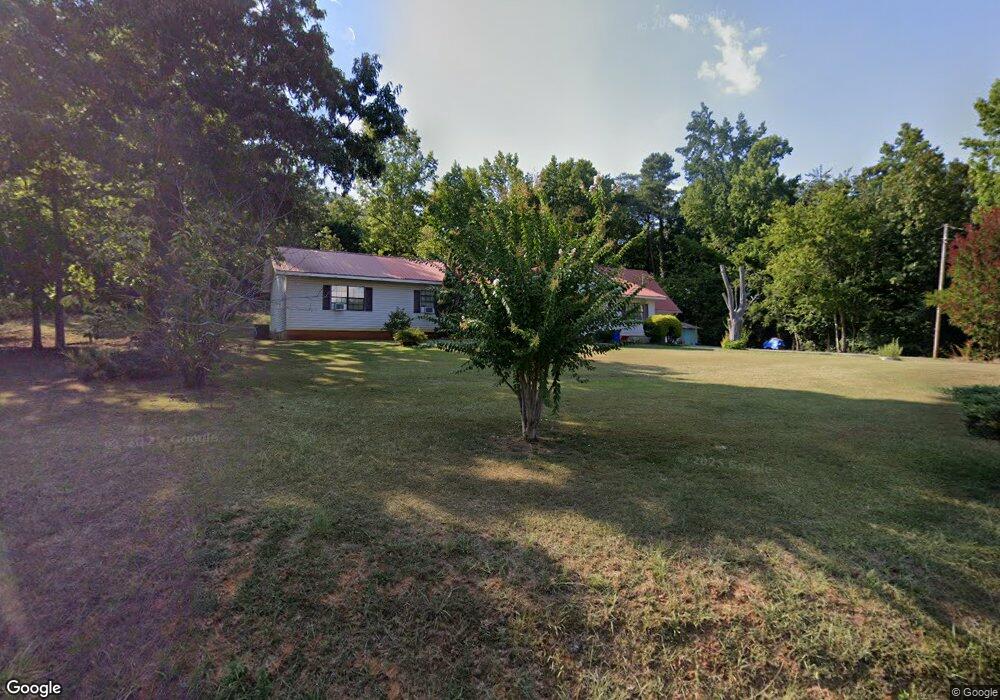
220 Cotton Cir Chatsworth, GA 30705
Estimated Value: $289,000 - $463,000
4
Beds
3
Baths
2,352
Sq Ft
$150/Sq Ft
Est. Value
About This Home
This home is located at 220 Cotton Cir, Chatsworth, GA 30705 and is currently estimated at $352,633, approximately $149 per square foot. 220 Cotton Cir is a home located in Murray County with nearby schools including Woodlawn Elementary School, Bagley Middle School, and North Murray High School.
Ownership History
Date
Name
Owned For
Owner Type
Purchase Details
Closed on
Jan 28, 2005
Sold by
Federal National Mortgage Association
Bought by
Blanco Jorge R and Marroquin Emerita D
Current Estimated Value
Home Financials for this Owner
Home Financials are based on the most recent Mortgage that was taken out on this home.
Original Mortgage
$129,000
Outstanding Balance
$65,439
Interest Rate
5.72%
Mortgage Type
New Conventional
Estimated Equity
$287,194
Purchase Details
Closed on
Nov 2, 2004
Sold by
Union Planters Bank Na
Bought by
Federal National Mortgage Association
Purchase Details
Closed on
Jan 2, 2002
Sold by
Rymer Joan R
Bought by
Bridges Judy G
Purchase Details
Closed on
Sep 21, 2001
Sold by
Rymer Joan R
Bought by
Bridges Judy G
Purchase Details
Closed on
May 1, 2000
Sold by
Bridges Judy G
Bought by
Bridges Judy G
Purchase Details
Closed on
Mar 2, 2000
Sold by
Bridges Judy G
Bought by
Bridges Judy G
Purchase Details
Closed on
Dec 28, 1989
Bought by
Bridges Judy G
Create a Home Valuation Report for This Property
The Home Valuation Report is an in-depth analysis detailing your home's value as well as a comparison with similar homes in the area
Home Values in the Area
Average Home Value in this Area
Purchase History
| Date | Buyer | Sale Price | Title Company |
|---|---|---|---|
| Blanco Jorge R | -- | -- | |
| Federal National Mortgage Association | $151,100 | -- | |
| Union Planters Bank Na | $151,100 | -- | |
| Bridges Judy G | -- | -- | |
| Bridges Judy G | -- | -- | |
| Bridges Judy G | -- | -- | |
| Bridges Judy G | -- | -- | |
| Bridges Judy G | $55,000 | -- |
Source: Public Records
Mortgage History
| Date | Status | Borrower | Loan Amount |
|---|---|---|---|
| Open | Blanco Jorge R | $129,000 |
Source: Public Records
Tax History Compared to Growth
Tax History
| Year | Tax Paid | Tax Assessment Tax Assessment Total Assessment is a certain percentage of the fair market value that is determined by local assessors to be the total taxable value of land and additions on the property. | Land | Improvement |
|---|---|---|---|---|
| 2024 | $1,588 | $138,336 | $6,280 | $132,056 |
| 2023 | $1,649 | $134,484 | $6,280 | $128,204 |
| 2022 | $1,608 | $117,284 | $6,280 | $111,004 |
| 2021 | $1,669 | $96,284 | $6,960 | $89,324 |
| 2020 | $1,669 | $82,044 | $6,960 | $75,084 |
| 2019 | $1,681 | $78,724 | $6,960 | $71,764 |
| 2018 | $1,681 | $78,724 | $6,960 | $71,764 |
| 2017 | $0 | $76,604 | $6,960 | $69,644 |
| 2016 | $1,453 | $65,676 | $8,800 | $56,876 |
| 2015 | -- | $60,596 | $8,800 | $51,796 |
| 2014 | -- | $60,596 | $8,800 | $51,796 |
| 2013 | -- | $60,596 | $8,800 | $51,796 |
Source: Public Records
Map
Nearby Homes
- 401 Earls Way
- 216 Earls Way
- 38 Earls Way
- 22 Earls Way
- 104 W Madison St
- 42 Evergreen Rd Unit LOT N
- 44 E Madison St
- 38 Keating St
- 105 Keating St
- 0 Riley St Unit 10427525
- L113 Riley St
- 123 W Riley St
- 121 Maga Lynn Way
- 51 W Riley St
- 332 Village Creek Dr
- 431 Mount Carmel Church Rd
- 316 Mount Carmel Church Rd
- 1336 Georgia 286
- 1800 Georgia 286
- 181 Cobb Rd
- 194 Cotton Cir
- 260 Cotton Cir
- 225 Cotton Cir
- 180 Cotton Cir
- 161 Cotton Cir
- 257 Cotton Cir
- 156 Cotton Cir
- 108 Barley Dr
- 140 Barley Dr
- 00 Cotton Cir
- 0 Cotton Cir Unit 76152
- 0 Cotton Cir Unit 8547923
- 0 Cotton Cir Unit 7637570
- 178 Barley Dr
- 1109 Cotton Cir
- 1145 Cotton Cir
- 1145 Cotton Cir Unit 91,115PT92
- 124 Cotton Cir
- 88 Barley Dr
- 88 Barley Dr Unit 39