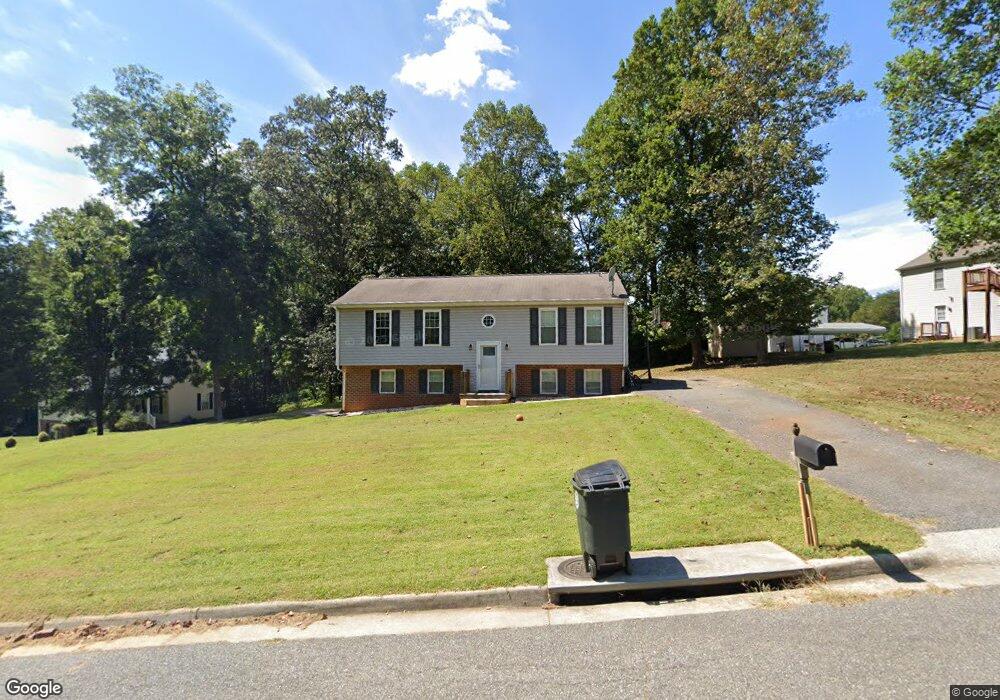
220 Dove Ct Lynchburg, VA 24501
Estimated Value: $233,000 - $305,514
4
Beds
3
Baths
1,896
Sq Ft
$148/Sq Ft
Est. Value
About This Home
This home is located at 220 Dove Ct, Lynchburg, VA 24501 and is currently estimated at $280,129, approximately $147 per square foot. 220 Dove Ct is a home located in Lynchburg City with nearby schools including Sheffield Elementary School, Paul Laurence Dunbar Mid. for Innov., and Heritage High School.
Ownership History
Date
Name
Owned For
Owner Type
Purchase Details
Closed on
Jul 23, 2012
Sold by
Shupe Kendall and Shupe Jennifer D
Bought by
Shupe Jennifer D
Current Estimated Value
Purchase Details
Closed on
Nov 19, 2010
Sold by
Schley Matthew R and Schley Michelle L
Bought by
Shupe Kandall and Shupe Jennifer D
Home Financials for this Owner
Home Financials are based on the most recent Mortgage that was taken out on this home.
Original Mortgage
$119,900
Interest Rate
4.23%
Mortgage Type
New Conventional
Create a Home Valuation Report for This Property
The Home Valuation Report is an in-depth analysis detailing your home's value as well as a comparison with similar homes in the area
Home Values in the Area
Average Home Value in this Area
Purchase History
| Date | Buyer | Sale Price | Title Company |
|---|---|---|---|
| Shupe Jennifer D | -- | Reliance Title & Settlement | |
| Shupe Kandall | -- | None Available |
Source: Public Records
Mortgage History
| Date | Status | Borrower | Loan Amount |
|---|---|---|---|
| Previous Owner | Shupe Kandall | $119,900 |
Source: Public Records
Tax History Compared to Growth
Tax History
| Year | Tax Paid | Tax Assessment Tax Assessment Total Assessment is a certain percentage of the fair market value that is determined by local assessors to be the total taxable value of land and additions on the property. | Land | Improvement |
|---|---|---|---|---|
| 2025 | $2,426 | $288,800 | $45,000 | $243,800 |
| 2024 | $1,768 | $198,600 | $35,000 | $163,600 |
| 2023 | $1,768 | $198,600 | $35,000 | $163,600 |
| 2022 | $1,633 | $158,500 | $35,000 | $123,500 |
| 2021 | $1,759 | $158,500 | $35,000 | $123,500 |
| 2020 | $1,668 | $150,300 | $35,000 | $115,300 |
| 2019 | $1,668 | $150,300 | $35,000 | $115,300 |
| 2018 | $1,598 | $144,000 | $30,000 | $114,000 |
| 2017 | $1,598 | $144,000 | $30,000 | $114,000 |
| 2016 | $1,598 | $144,000 | $30,000 | $114,000 |
| 2015 | $1,598 | $144,000 | $30,000 | $114,000 |
| 2014 | $1,598 | $144,000 | $30,000 | $114,000 |
Source: Public Records
Map
Nearby Homes
- 101 Wessex Rd
- 601 Burton Creek Place
- 206 Jordan Ct
- 214 Jordan Ct
- 207 Ethan Ct
- 235 Jordan Ct
- 255 Jordan Ct
- 5904 Rhonda Rd
- 6012 Rhonda Rd
- 307 Keywood Dr
- 119 Fleetwood Dr
- 300 McConville Rd Unit 63
- 300 McConville Rd Unit 58
- 618 Hayes Dr
- 4700 Greenwood Dr
- 723 Custer Dr
- 4704 Greenwood Dr
- 4632 Golf Park Dr
- 625 Sherman Dr
- 916 Sanhill Dr