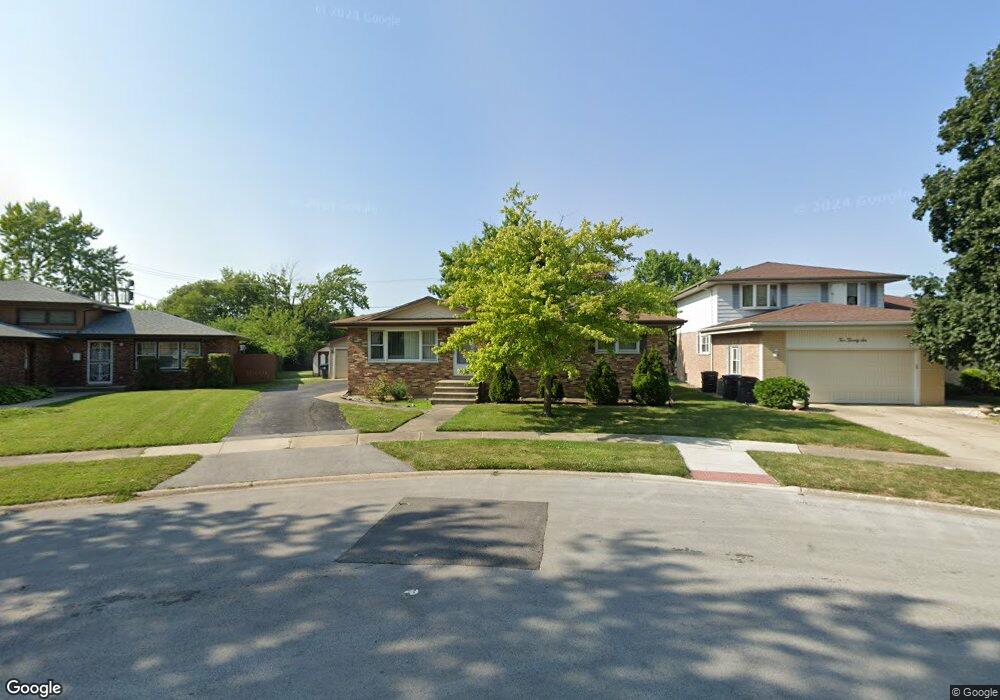
220 E 164th Place South Holland, IL 60473
Central District NeighborhoodEstimated Value: $207,000 - $274,000
3
Beds
2
Baths
1,125
Sq Ft
$206/Sq Ft
Est. Value
About This Home
This home is located at 220 E 164th Place, South Holland, IL 60473 and is currently estimated at $232,284, approximately $206 per square foot. 220 E 164th Place is a home located in Cook County with nearby schools including Taft School, Eisenhower School, and Coolidge Middle School.
Ownership History
Date
Name
Owned For
Owner Type
Purchase Details
Closed on
Jul 11, 2006
Sold by
Babbe Ed
Bought by
Garcia Manuel and Garcia Lidia
Current Estimated Value
Home Financials for this Owner
Home Financials are based on the most recent Mortgage that was taken out on this home.
Original Mortgage
$119,000
Outstanding Balance
$70,959
Interest Rate
6.73%
Mortgage Type
Unknown
Estimated Equity
$161,325
Purchase Details
Closed on
Jan 3, 2006
Sold by
Reo Management 2004 Inc
Bought by
Babbe Ed
Purchase Details
Closed on
Nov 11, 2005
Sold by
Howard
Bought by
Reo Management 2004 Inc
Purchase Details
Closed on
Jul 22, 1997
Sold by
Vansomeren Marvin D and Vansomeren Valerie A
Bought by
Howard Jerry
Home Financials for this Owner
Home Financials are based on the most recent Mortgage that was taken out on this home.
Original Mortgage
$112,066
Interest Rate
7.81%
Mortgage Type
FHA
Create a Home Valuation Report for This Property
The Home Valuation Report is an in-depth analysis detailing your home's value as well as a comparison with similar homes in the area
Home Values in the Area
Average Home Value in this Area
Purchase History
| Date | Buyer | Sale Price | Title Company |
|---|---|---|---|
| Garcia Manuel | $194,000 | Chicago Title Insurance Co | |
| Babbe Ed | $130,000 | Pntn | |
| Reo Management 2004 Inc | -- | -- | |
| Howard Jerry | $113,000 | -- |
Source: Public Records
Mortgage History
| Date | Status | Borrower | Loan Amount |
|---|---|---|---|
| Open | Garcia Manuel | $119,000 | |
| Previous Owner | Howard Jerry | $112,066 |
Source: Public Records
Tax History Compared to Growth
Tax History
| Year | Tax Paid | Tax Assessment Tax Assessment Total Assessment is a certain percentage of the fair market value that is determined by local assessors to be the total taxable value of land and additions on the property. | Land | Improvement |
|---|---|---|---|---|
| 2024 | $6,084 | $19,000 | $4,653 | $14,347 |
| 2023 | $3,542 | $19,000 | $4,653 | $14,347 |
| 2022 | $3,542 | $12,067 | $3,988 | $8,079 |
| 2021 | $3,599 | $12,066 | $3,988 | $8,078 |
| 2020 | $3,620 | $12,066 | $3,988 | $8,078 |
| 2019 | $5,115 | $12,189 | $3,545 | $8,644 |
| 2018 | $4,992 | $12,189 | $3,545 | $8,644 |
| 2017 | $4,882 | $12,189 | $3,545 | $8,644 |
| 2016 | $4,800 | $11,348 | $3,323 | $8,025 |
| 2015 | $4,588 | $11,348 | $3,323 | $8,025 |
| 2014 | $3,573 | $11,348 | $3,323 | $8,025 |
| 2013 | $5,036 | $13,012 | $3,323 | $9,689 |
Source: Public Records
Map
Nearby Homes
- 131 E 163rd St Unit 16A
- 16524 Woodlawn West Ave
- 429 E 164th Place
- 16428 Wabash Ave
- 16550 Elm Ct
- 16626 Holland Ave
- 16535 Elm Ct
- 1 E 164th St
- 16339 State St
- 16254 Prairie Ave
- 60 E 162nd St
- 16411 Claire Ln
- 520 E 166th St
- 505 Betty Ln
- 503 Marie Dr
- 16211 Joyce Cir
- 452 E 167th St
- 509 E 161st Place
- 16417 School St
- 16419 School St
- 226 E 164th Place
- 216 E 164th Place
- 232 E 164th Place
- 16436 Wausau Ct
- 238 E 164th Place
- 229 E 164th Place
- 16442 Wausau Ct
- 244 E 164th Place
- 16447 Wausau Ct
- 16448 Wausau Ct
- 237 E 164th Place
- 16407 Woodlawn West Ave
- 16401 Woodlawn West Ave
- 16407 Woodlawn Ave W
- 16413 Woodlawn West Ave
- 250 E 164th Place
- 243 E 164th Place
- 16454 Wausau Ct
- 16453 Wausau Ct
- 16419 Woodlawn Ave W