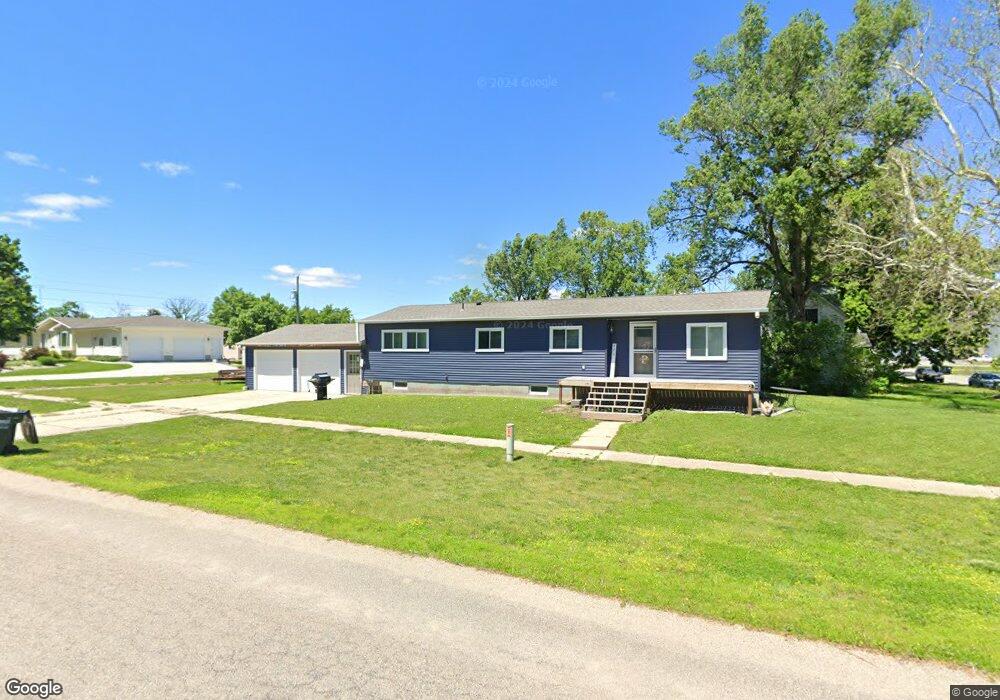
220 E 3rd St Clarkson, NE 68629
Estimated Value: $116,000 - $177,908
3
Beds
2
Baths
1,296
Sq Ft
$110/Sq Ft
Est. Value
About This Home
This home is located at 220 E 3rd St, Clarkson, NE 68629 and is currently estimated at $142,977, approximately $110 per square foot. 220 E 3rd St is a home located in Colfax County with nearby schools including Clarkson Elementary School, Clarkson Junior/Senior High School, and Saint John Neumann Catholic School.
Ownership History
Date
Name
Owned For
Owner Type
Purchase Details
Closed on
Oct 30, 2015
Sold by
Urbanek Nathan J and Urbanek Leslie
Bought by
Pospichal Joseph A and Pospichal Samantha J
Current Estimated Value
Home Financials for this Owner
Home Financials are based on the most recent Mortgage that was taken out on this home.
Original Mortgage
$38,000
Outstanding Balance
$29,959
Interest Rate
3.94%
Mortgage Type
Future Advance Clause Open End Mortgage
Estimated Equity
$113,018
Purchase Details
Closed on
Jul 30, 2014
Sold by
Sayers Alan M and Sayers Jacqueline
Bought by
Urbanek Nathan J
Purchase Details
Closed on
Apr 18, 2011
Sold by
Sayers Matthew L and Sayers Kortney
Bought by
Urbanek Nathan J
Home Financials for this Owner
Home Financials are based on the most recent Mortgage that was taken out on this home.
Original Mortgage
$36,200
Interest Rate
4.91%
Mortgage Type
New Conventional
Create a Home Valuation Report for This Property
The Home Valuation Report is an in-depth analysis detailing your home's value as well as a comparison with similar homes in the area
Purchase History
| Date | Buyer | Sale Price | Title Company |
|---|---|---|---|
| Pospichal Joseph A | $43,000 | None Available | |
| Urbanek Nathan J | $1,500,000 | None Available | |
| Urbanek Nathan J | $35,000 | -- |
Source: Public Records
Mortgage History
| Date | Status | Borrower | Loan Amount |
|---|---|---|---|
| Open | Pospichal Joseph A | $38,000 | |
| Previous Owner | Urbanek Nathan J | $36,200 |
Source: Public Records
Tax History
| Year | Tax Paid | Tax Assessment Tax Assessment Total Assessment is a certain percentage of the fair market value that is determined by local assessors to be the total taxable value of land and additions on the property. | Land | Improvement |
|---|---|---|---|---|
| 2025 | $1,553 | $108,825 | $5,040 | $103,785 |
| 2024 | $1,448 | $106,890 | $5,040 | $101,850 |
| 2023 | $1,448 | $95,445 | $5,040 | $90,405 |
| 2022 | $1,303 | $81,645 | $5,040 | $76,605 |
| 2021 | $906 | $56,315 | $5,040 | $51,275 |
| 2020 | $910 | $56,315 | $5,040 | $51,275 |
| 2019 | $887 | $55,475 | $4,200 | $51,275 |
| 2018 | $1,007 | $62,540 | $4,200 | $58,340 |
| 2017 | $905 | $55,120 | $4,200 | $50,920 |
| 2016 | $901 | $55,120 | $4,200 | $50,920 |
| 2015 | $918 | $55,120 | $4,200 | $50,920 |
| 2014 | $1,144 | $55,035 | $4,200 | $50,835 |
Source: Public Records
Map
Nearby Homes
Your Personal Tour Guide
Ask me questions while you tour the home.