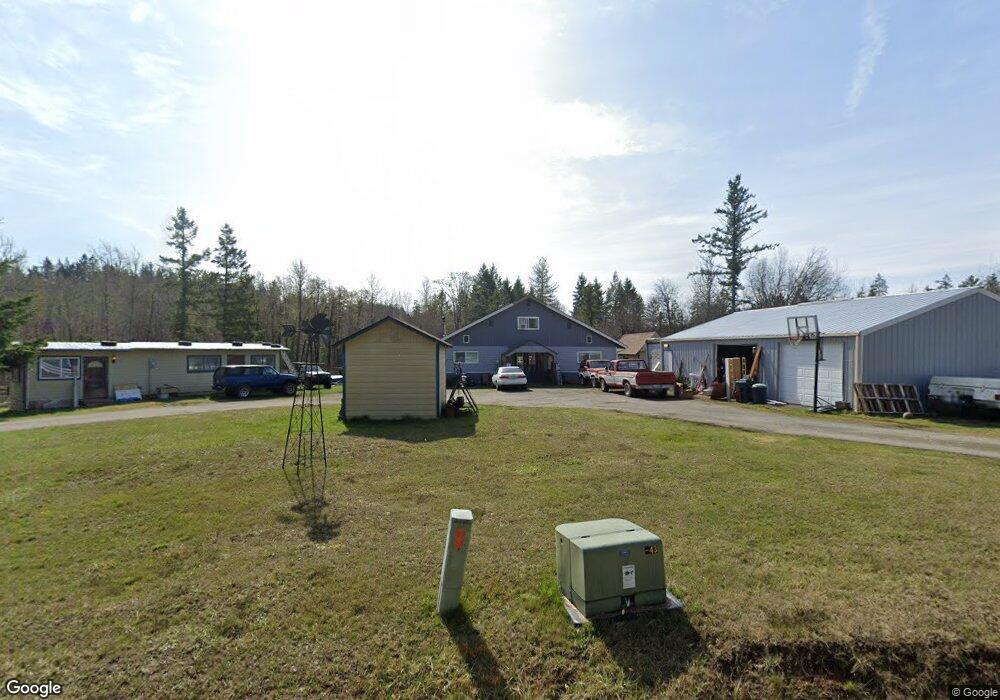
220 E Benson Loop Rd Shelton, WA 98584
Estimated Value: $277,000 - $902,000
4
Beds
4
Baths
2,120
Sq Ft
$262/Sq Ft
Est. Value
About This Home
This home is located at 220 E Benson Loop Rd, Shelton, WA 98584 and is currently estimated at $555,013, approximately $261 per square foot. 220 E Benson Loop Rd is a home located in Mason County with nearby schools including Pioneer Primary School and Pioneer Intermediate/Middle School.
Ownership History
Date
Name
Owned For
Owner Type
Purchase Details
Closed on
Jan 7, 2020
Sold by
Secretary Of Housing & Urban Development
Bought by
Roberts Christal A and Thomas Linda J
Current Estimated Value
Home Financials for this Owner
Home Financials are based on the most recent Mortgage that was taken out on this home.
Original Mortgage
$320,336
Outstanding Balance
$283,030
Interest Rate
3.6%
Mortgage Type
FHA
Estimated Equity
$271,983
Purchase Details
Closed on
Apr 4, 2019
Sold by
Jpmorgan Chase Bank National Association
Bought by
Secretary Of Housing And Urban Dev
Purchase Details
Closed on
Mar 20, 2019
Sold by
Stephens Gary W and Stephens Elishia L
Bought by
Jpmorgan Chase Bank National Association
Purchase Details
Closed on
Aug 6, 2013
Sold by
Federal National Mortgage Association
Bought by
Stephens Gary
Create a Home Valuation Report for This Property
The Home Valuation Report is an in-depth analysis detailing your home's value as well as a comparison with similar homes in the area
Purchase History
| Date | Buyer | Sale Price | Title Company |
|---|---|---|---|
| Roberts Christal A | -- | Land Title Company | |
| Secretary Of Housing And Urban Dev | -- | Land Title Co | |
| Jpmorgan Chase Bank National Association | $260,400 | None Available | |
| Stephens Gary | $63,000 | Land Title Co |
Source: Public Records
Mortgage History
| Date | Status | Borrower | Loan Amount |
|---|---|---|---|
| Open | Roberts Christal A | $320,336 |
Source: Public Records
Tax History
| Year | Tax Paid | Tax Assessment Tax Assessment Total Assessment is a certain percentage of the fair market value that is determined by local assessors to be the total taxable value of land and additions on the property. | Land | Improvement |
|---|---|---|---|---|
| 2025 | $2,373 | $274,800 | $87,325 | $187,475 |
| 2024 | $2,373 | $296,820 | $110,045 | $186,775 |
| 2023 | $2,699 | $299,470 | $95,095 | $204,375 |
| 2022 | $2,310 | $233,340 | $76,685 | $156,655 |
| 2021 | $2,816 | $233,340 | $76,685 | $156,655 |
| 2020 | $2,673 | $262,855 | $75,180 | $187,675 |
| 2018 | $2,297 | $195,415 | $67,575 | $127,840 |
| 2017 | $2,777 | $195,420 | $67,580 | $127,840 |
| 2016 | $2,715 | $243,570 | $77,760 | $165,810 |
| 2015 | $2,506 | $237,770 | $75,330 | $162,440 |
| 2014 | -- | $242,985 | $76,950 | $166,035 |
| 2013 | -- | $237,590 | $72,900 | $164,690 |
Source: Public Records
Map
Nearby Homes
- 91 E Franjo Beach Dr
- 373 E Budd Dr
- 170 E Lakeshore Dr E
- 81 E Annas Way
- 480 E Lakeshore Dr E
- 350 E Lakeshore Dr W
- 140 E Elk Place
- 5151 E Pickering Rd
- 371 E Lakeshore Dr W
- 170 E Pickering Dr
- 561 E Lakeshore Dr W
- 241 E Park Loop
- 0 Lot 136 E Agate Rd
- 150 E Willopa Rd
- 140 E Timberlake Dr
- 281 E Mclane Dr
- 4 XX SE Sea Der Hok Ln
- 6350 SE Arcadia Rd
- 80 E Carr Place
- 31 E Colvos Place E
- 220 E Benson Loop
- 1670 E Benson Loop
- 0 E Benson Rd
- 0 E Benson Rd
- 0 E Benson Ridge Rd
- 0 E Benson Loop Rd
- 7 E Benson Loop Rd
- 230 E Benson Loop
- 11901200 E Agate Rd
- 250 E Benson Loop
- 1431 E Benson Loop Rd
- 6612 E Agate Rd
- 6670 E Agate Rd
- 6610 E Agate Rd
- 407 E Benson Loop Rd
- 1423 E Benson Loop Rd
- 810 E Benson Loop Rd
- 1021 E Benson Loop
- 1310 E Benson Loop
Your Personal Tour Guide
Ask me questions while you tour the home.