Estimated Value: $206,000 - $351,000
3
Beds
2
Baths
1,380
Sq Ft
$189/Sq Ft
Est. Value
About This Home
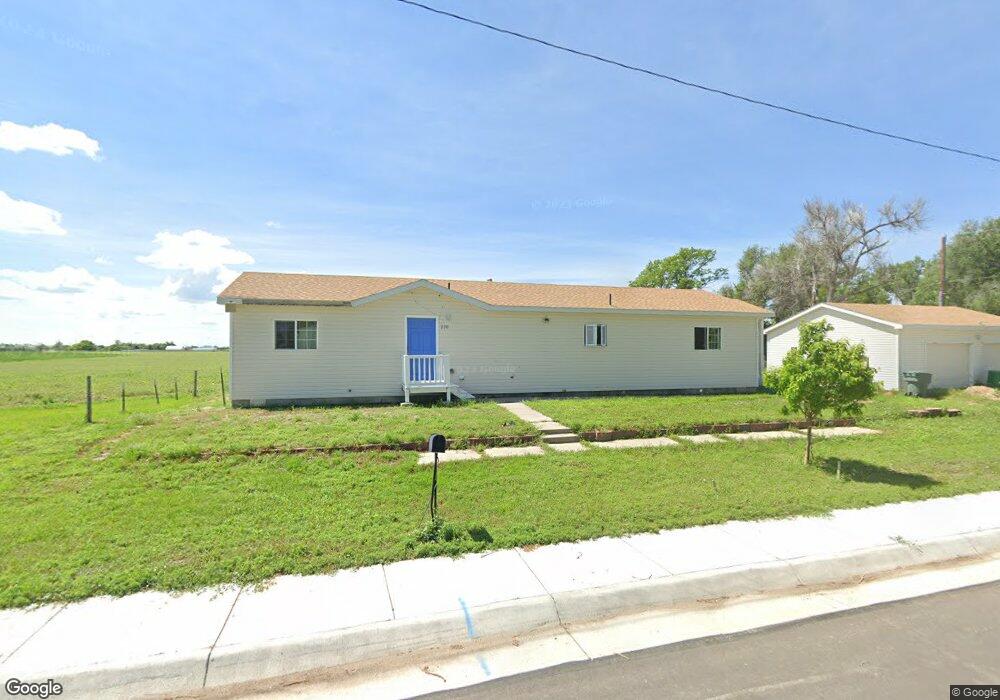
This home is located at 220 E Knearl St, Brush, CO 80723 and is currently estimated at $260,401, approximately $188 per square foot. 220 E Knearl St is a home located in Morgan County with nearby schools including Thomson Primary School, Beaver Valley Elementary School, and Brush Middle School.
Ownership History
Date
Name
Owned For
Owner Type
Purchase Details
Closed on
Apr 11, 2022
Sold by
Hunter Hohn Nathaniel
Bought by
Miller Marshall and Miller Jennifer
Current Estimated Value
Purchase Details
Closed on
Apr 10, 2015
Sold by
Hohn Robert Steven
Bought by
Hohn Nathaniel Hunter
Purchase Details
Closed on
Mar 2, 2012
Sold by
Hoskins Julia A
Bought by
Hohn Robert Steven
Home Financials for this Owner
Home Financials are based on the most recent Mortgage that was taken out on this home.
Original Mortgage
$109,000
Interest Rate
4.05%
Mortgage Type
Purchase Money Mortgage
Purchase Details
Closed on
Mar 25, 2011
Sold by
Wardell Robert L and Wardell Donna S
Bought by
Hoskins Julia A
Home Financials for this Owner
Home Financials are based on the most recent Mortgage that was taken out on this home.
Original Mortgage
$199,000
Interest Rate
5.06%
Mortgage Type
Seller Take Back
Create a Home Valuation Report for This Property
The Home Valuation Report is an in-depth analysis detailing your home's value as well as a comparison with similar homes in the area
Home Values in the Area
Average Home Value in this Area
Purchase History
| Date | Buyer | Sale Price | Title Company |
|---|---|---|---|
| Miller Marshall | $215,000 | None Listed On Document | |
| Hohn Nathaniel Hunter | $105,000 | None Available | |
| Hohn Robert Steven | $109,000 | None Available | |
| Hoskins Julia A | $115,000 | None Available |
Source: Public Records
Mortgage History
| Date | Status | Borrower | Loan Amount |
|---|---|---|---|
| Previous Owner | Hohn Robert Steven | $109,000 | |
| Previous Owner | Hoskins Julia A | $199,000 |
Source: Public Records
Tax History
| Year | Tax Paid | Tax Assessment Tax Assessment Total Assessment is a certain percentage of the fair market value that is determined by local assessors to be the total taxable value of land and additions on the property. | Land | Improvement |
|---|---|---|---|---|
| 2024 | $1,232 | $11,940 | $620 | $11,320 |
| 2023 | $1,232 | $15,620 | $810 | $14,810 |
| 2022 | $1,969 | $18,980 | $840 | $18,140 |
| 2021 | $2,000 | $19,530 | $870 | $18,660 |
| 2020 | $1,727 | $16,830 | $770 | $16,060 |
| 2019 | $1,775 | $16,830 | $770 | $16,060 |
| 2018 | $1,231 | $11,520 | $780 | $10,740 |
| 2017 | $1,227 | $11,520 | $780 | $10,740 |
| 2016 | $1,073 | $10,780 | $640 | $10,140 |
| 2015 | $971 | $10,780 | $640 | $10,140 |
| 2014 | -- | $10,180 | $520 | $9,660 |
| 2013 | -- | $10,180 | $520 | $9,660 |
Source: Public Records
Map
Nearby Homes
- 124 Bruse St
- 116 S Clifton St
- 216 S Colorado Ave
- 216 E Edmunds St
- 407 Carson St
- 22 Circle Dr
- 28840 County Road R
- 505 Carson St
- 5 Circle Dr
- 706 Cameron St
- 710 Carson St
- 17492 County Road 29
- 507 Lincoln St
- 724 Carson St
- 508 Lincoln St
- 0 Daniels St Unit Lot 01 1004599
- 0 Daniels St Unit Lot 13 1004810
- 0 Daniels St Unit Lot 11 1004797
- 0 Daniels St
- 0 Daniels St Unit Lot 12 1004800