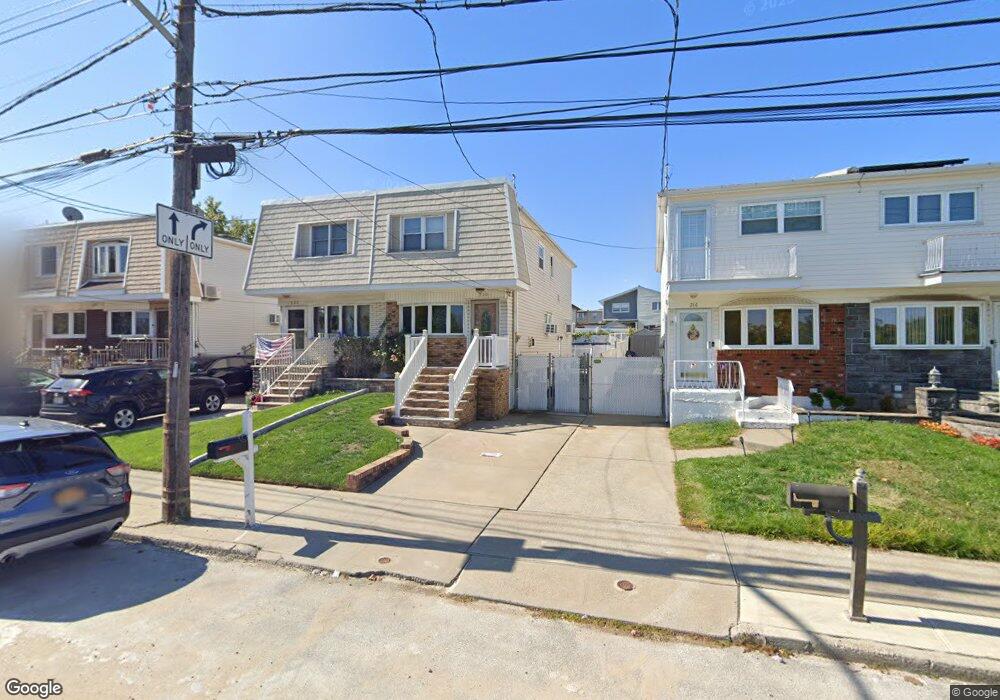
220 Fahy Ave Staten Island, NY 10314
Bulls Head NeighborhoodEstimated Value: $660,611 - $696,000
3
Beds
2
Baths
1,350
Sq Ft
$504/Sq Ft
Est. Value
About This Home
This home is located at 220 Fahy Ave, Staten Island, NY 10314 and is currently estimated at $680,403, approximately $504 per square foot. 220 Fahy Ave is a home located in Richmond County with nearby schools including P.S. 060 Alice Austen School, Is 72 Rocco Laurie, and Port Richmond High School.
Ownership History
Date
Name
Owned For
Owner Type
Purchase Details
Closed on
Dec 11, 2000
Sold by
Luis Dominador H and Luis Evelina C
Bought by
Gennaro Frank and Gennaro Lorrie
Current Estimated Value
Home Financials for this Owner
Home Financials are based on the most recent Mortgage that was taken out on this home.
Original Mortgage
$185,050
Interest Rate
7.14%
Mortgage Type
FHA
Create a Home Valuation Report for This Property
The Home Valuation Report is an in-depth analysis detailing your home's value as well as a comparison with similar homes in the area
Home Values in the Area
Average Home Value in this Area
Purchase History
| Date | Buyer | Sale Price | Title Company |
|---|---|---|---|
| Gennaro Frank | $191,000 | Washington Title |
Source: Public Records
Mortgage History
| Date | Status | Borrower | Loan Amount |
|---|---|---|---|
| Previous Owner | Gennaro Frank | $185,050 |
Source: Public Records
Tax History Compared to Growth
Tax History
| Year | Tax Paid | Tax Assessment Tax Assessment Total Assessment is a certain percentage of the fair market value that is determined by local assessors to be the total taxable value of land and additions on the property. | Land | Improvement |
|---|---|---|---|---|
| 2025 | $4,526 | $38,940 | $5,160 | $33,780 |
| 2024 | $4,538 | $37,560 | $5,047 | $32,513 |
| 2023 | $4,576 | $23,933 | $5,015 | $18,918 |
| 2022 | $4,455 | $32,040 | $7,920 | $24,120 |
| 2021 | $4,413 | $31,740 | $7,920 | $23,820 |
| 2020 | $4,179 | $29,040 | $7,920 | $21,120 |
| 2019 | $3,879 | $28,140 | $7,920 | $20,220 |
| 2018 | $3,768 | $19,944 | $6,500 | $13,444 |
| 2017 | $3,735 | $19,794 | $6,894 | $12,900 |
| 2016 | $3,423 | $18,674 | $7,186 | $11,488 |
| 2015 | $2,885 | $17,617 | $6,191 | $11,426 |
| 2014 | $2,885 | $16,620 | $6,600 | $10,020 |
Source: Public Records
Map
Nearby Homes