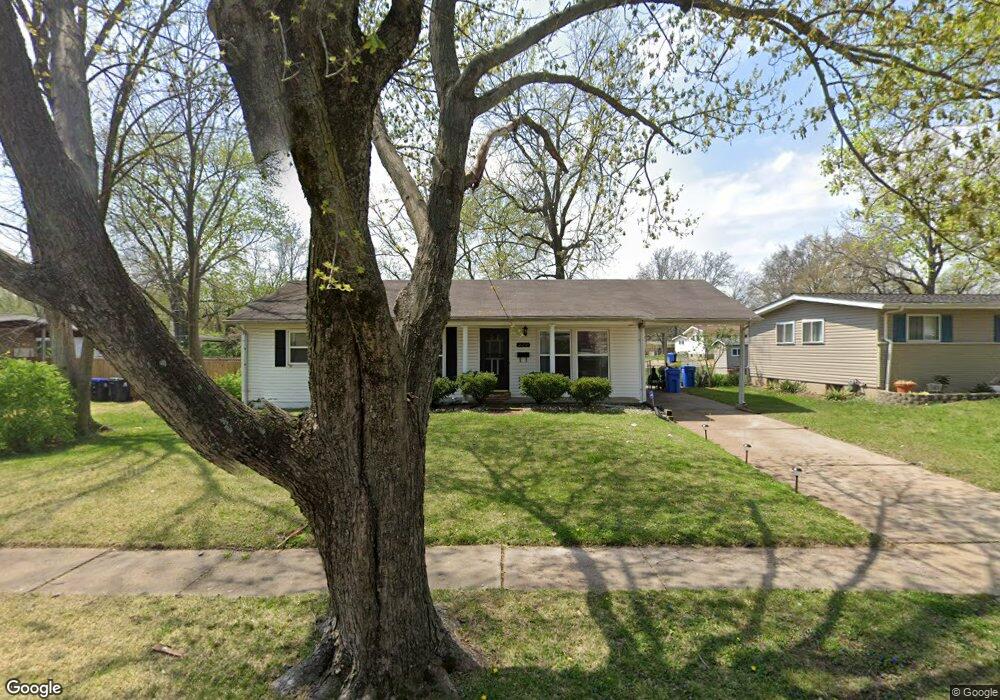
220 Falcon Dr Florissant, MO 63031
Estimated Value: $163,000 - $197,000
3
Beds
2
Baths
1,118
Sq Ft
$161/Sq Ft
Est. Value
About This Home
This home is located at 220 Falcon Dr, Florissant, MO 63031 and is currently estimated at $179,723, approximately $160 per square foot. 220 Falcon Dr is a home located in St. Louis County with nearby schools including Jana Elementary School, Northwest Middle School, and Hazelwood West High School.
Ownership History
Date
Name
Owned For
Owner Type
Purchase Details
Closed on
May 15, 2013
Sold by
Mu Investment Property Llc
Bought by
A & W Opportunities Llc
Current Estimated Value
Purchase Details
Closed on
Sep 5, 2012
Sold by
Pendleton Brandy
Bought by
Mu Investment Property Llc
Purchase Details
Closed on
May 16, 2008
Sold by
G Stafford Co
Bought by
Pendleton Brandy
Home Financials for this Owner
Home Financials are based on the most recent Mortgage that was taken out on this home.
Original Mortgage
$119,464
Interest Rate
5.86%
Mortgage Type
Seller Take Back
Purchase Details
Closed on
Apr 29, 2008
Sold by
C & M Properties Llc and Millner Claudia
Bought by
G Stafford Co
Home Financials for this Owner
Home Financials are based on the most recent Mortgage that was taken out on this home.
Original Mortgage
$119,464
Interest Rate
5.86%
Mortgage Type
Seller Take Back
Purchase Details
Closed on
Jan 9, 2008
Sold by
Millner Claudia
Bought by
Citibank Na and Certificateholders Of Bear Stearns Asset
Purchase Details
Closed on
Jul 1, 2005
Sold by
Millner Claudia
Bought by
C & M Properties Llc
Home Financials for this Owner
Home Financials are based on the most recent Mortgage that was taken out on this home.
Original Mortgage
$40,150
Interest Rate
5.64%
Mortgage Type
Stand Alone Second
Purchase Details
Closed on
Jun 30, 2005
Sold by
Kamp Christine M and Donovan Michael A
Bought by
Millner Claudia
Home Financials for this Owner
Home Financials are based on the most recent Mortgage that was taken out on this home.
Original Mortgage
$40,150
Interest Rate
5.64%
Mortgage Type
Stand Alone Second
Purchase Details
Closed on
Apr 30, 2003
Sold by
Missouri Real Estate School
Bought by
Kamp Christine M and Donovan Michael A
Home Financials for this Owner
Home Financials are based on the most recent Mortgage that was taken out on this home.
Original Mortgage
$112,140
Interest Rate
5.65%
Mortgage Type
FHA
Purchase Details
Closed on
Dec 4, 2002
Sold by
Pesek Robert J
Bought by
Missouri Real Estate School
Home Financials for this Owner
Home Financials are based on the most recent Mortgage that was taken out on this home.
Original Mortgage
$63,750
Interest Rate
6.05%
Purchase Details
Closed on
Sep 1, 1998
Sold by
Deckelman Larry P and Deckelman Marquita M
Bought by
Pesek Robert J
Home Financials for this Owner
Home Financials are based on the most recent Mortgage that was taken out on this home.
Original Mortgage
$69,505
Interest Rate
6.95%
Mortgage Type
FHA
Create a Home Valuation Report for This Property
The Home Valuation Report is an in-depth analysis detailing your home's value as well as a comparison with similar homes in the area
Home Values in the Area
Average Home Value in this Area
Purchase History
| Date | Buyer | Sale Price | Title Company |
|---|---|---|---|
| A & W Opportunities Llc | $47,000 | It | |
| Mu Investment Property Llc | $37,900 | None Available | |
| Pendleton Brandy | $119,900 | None Available | |
| G Stafford Co | $56,251 | None Available | |
| Citibank Na | $81,040 | None Available | |
| C & M Properties Llc | -- | -- | |
| Millner Claudia | $114,750 | -- | |
| Kamp Christine M | $113,900 | -- | |
| Missouri Real Estate School | $41,000 | -- | |
| Pesek Robert J | -- | First American Title |
Source: Public Records
Mortgage History
| Date | Status | Borrower | Loan Amount |
|---|---|---|---|
| Previous Owner | Pendleton Brandy | $119,464 | |
| Previous Owner | C & M Properties Llc | $40,150 | |
| Previous Owner | Millner Claudia | $74,550 | |
| Previous Owner | Kamp Christine M | $112,140 | |
| Previous Owner | Missouri Real Estate School | $63,750 | |
| Previous Owner | Pesek Robert J | $69,505 |
Source: Public Records
Tax History Compared to Growth
Tax History
| Year | Tax Paid | Tax Assessment Tax Assessment Total Assessment is a certain percentage of the fair market value that is determined by local assessors to be the total taxable value of land and additions on the property. | Land | Improvement |
|---|---|---|---|---|
| 2025 | $2,831 | $34,310 | $4,670 | $29,640 |
| 2024 | $2,831 | $31,720 | $4,070 | $27,650 |
| 2023 | $2,827 | $31,720 | $4,070 | $27,650 |
| 2022 | $2,422 | $24,180 | $4,670 | $19,510 |
| 2021 | $2,359 | $24,180 | $4,670 | $19,510 |
| 2020 | $2,028 | $19,500 | $3,120 | $16,380 |
| 2019 | $1,997 | $19,500 | $3,120 | $16,380 |
| 2018 | $1,835 | $16,460 | $2,380 | $14,080 |
| 2017 | $1,833 | $16,460 | $2,380 | $14,080 |
| 2016 | $1,722 | $15,240 | $2,380 | $12,860 |
| 2015 | $1,686 | $15,240 | $2,380 | $12,860 |
| 2014 | $1,832 | $17,100 | $3,440 | $13,660 |
Source: Public Records
Map
Nearby Homes
- 220 Versailles Dr
- 405 Wren Dr
- 235 Moule Dr
- 2315 Bramble Ln
- 2405 Orleans Ln
- 325 Moule Dr
- 420 Humes Ln
- 1215 Pamela Dr
- 1580 Queens Dr
- 1830 Apple Blossom Ct
- 1993 Greenheath Dr
- 2320 Patterson Rd
- 1415 Saint Jean St
- 37 Marquette Dr
- 2375 Hummingbird Dr
- 2036 Retford Dr
- 1365 Saint Jean St
- 515 Myrtle Dr
- 490 Lula Dr
- 425 Jana Dr