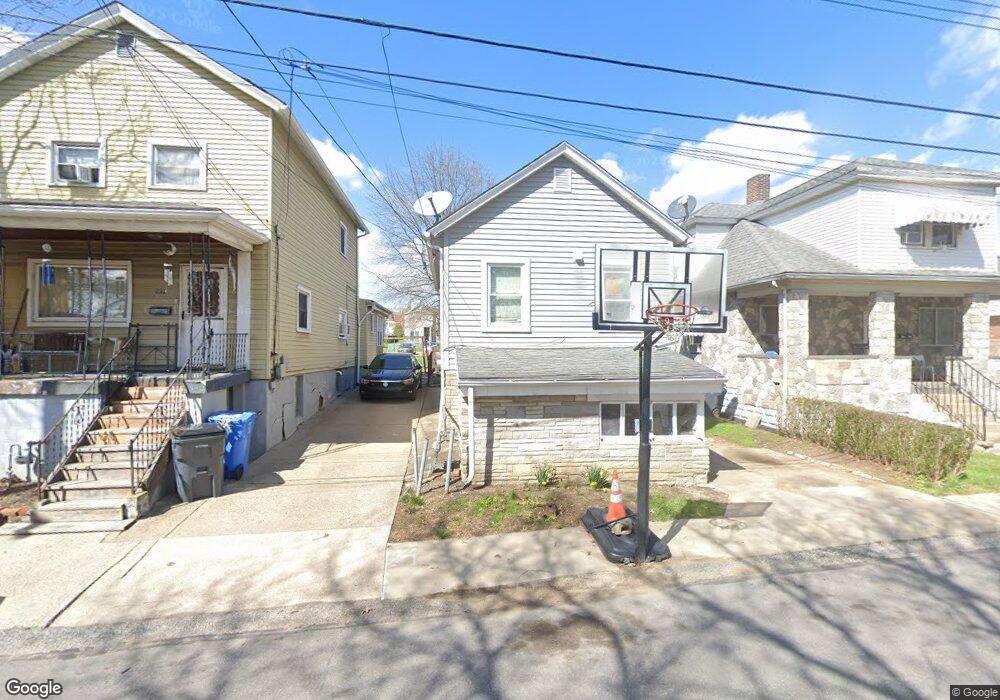
220 Finley Ave Carnegie, PA 15106
Estimated Value: $93,000 - $120,065
2
Beds
1
Bath
527
Sq Ft
$208/Sq Ft
Est. Value
About This Home
This home is located at 220 Finley Ave, Carnegie, PA 15106 and is currently estimated at $109,516, approximately $207 per square foot. 220 Finley Ave is a home located in Allegheny County with nearby schools including Chartiers Valley Intermediate School, Chartiers Valley Primary School, and Chartiers Valley Middle School.
Ownership History
Date
Name
Owned For
Owner Type
Purchase Details
Closed on
Jan 9, 2020
Sold by
Stansbury John J
Bought by
Jameson Joseph
Current Estimated Value
Home Financials for this Owner
Home Financials are based on the most recent Mortgage that was taken out on this home.
Original Mortgage
$66,500
Outstanding Balance
$58,755
Interest Rate
3.6%
Mortgage Type
New Conventional
Estimated Equity
$50,761
Purchase Details
Closed on
Apr 30, 2010
Sold by
Steele Mary K
Bought by
Stanbury John J
Create a Home Valuation Report for This Property
The Home Valuation Report is an in-depth analysis detailing your home's value as well as a comparison with similar homes in the area
Home Values in the Area
Average Home Value in this Area
Purchase History
| Date | Buyer | Sale Price | Title Company |
|---|---|---|---|
| Jameson Joseph | $70,000 | Brokers Settlement Services | |
| Stanbury John J | $17,000 | -- |
Source: Public Records
Mortgage History
| Date | Status | Borrower | Loan Amount |
|---|---|---|---|
| Open | Jameson Joseph | $66,500 |
Source: Public Records
Tax History Compared to Growth
Tax History
| Year | Tax Paid | Tax Assessment Tax Assessment Total Assessment is a certain percentage of the fair market value that is determined by local assessors to be the total taxable value of land and additions on the property. | Land | Improvement |
|---|---|---|---|---|
| 2025 | $2,016 | $61,300 | $15,800 | $45,500 |
| 2024 | $2,016 | $61,300 | $15,800 | $45,500 |
| 2023 | $1,796 | $61,300 | $15,800 | $45,500 |
| 2022 | $1,757 | $61,300 | $15,800 | $45,500 |
| 2021 | $85 | $18,000 | $15,800 | $2,200 |
| 2020 | $494 | $18,000 | $15,800 | $2,200 |
| 2019 | $486 | $18,000 | $15,800 | $2,200 |
| 2018 | $480 | $18,000 | $15,800 | $2,200 |
| 2017 | $480 | $18,000 | $15,800 | $2,200 |
| 2016 | $85 | $18,000 | $15,800 | $2,200 |
| 2015 | $85 | $18,000 | $15,800 | $2,200 |
| 2014 | $455 | $18,000 | $15,800 | $2,200 |
Source: Public Records
Map
Nearby Homes
- 323 Glenn Ave
- 1618 W Railroad St
- 431 Torrence Ave
- 519 Center St
- 430 Hill St
- 527 Orchard St
- 526 Magazine St
- 200 Marshall Ave
- 406 Hill Street Rear (Aka Spikenard Way)
- 534 Magazine St
- 428 Hoff St
- 726 Orchard St
- 631 Superior St
- 619 Grant Ave
- 533 Madison Ave
- 815 W Main St
- 301 1st Ave
- 613-615 W Main St
- 603 W Main St
- 685-691 Grant Ave