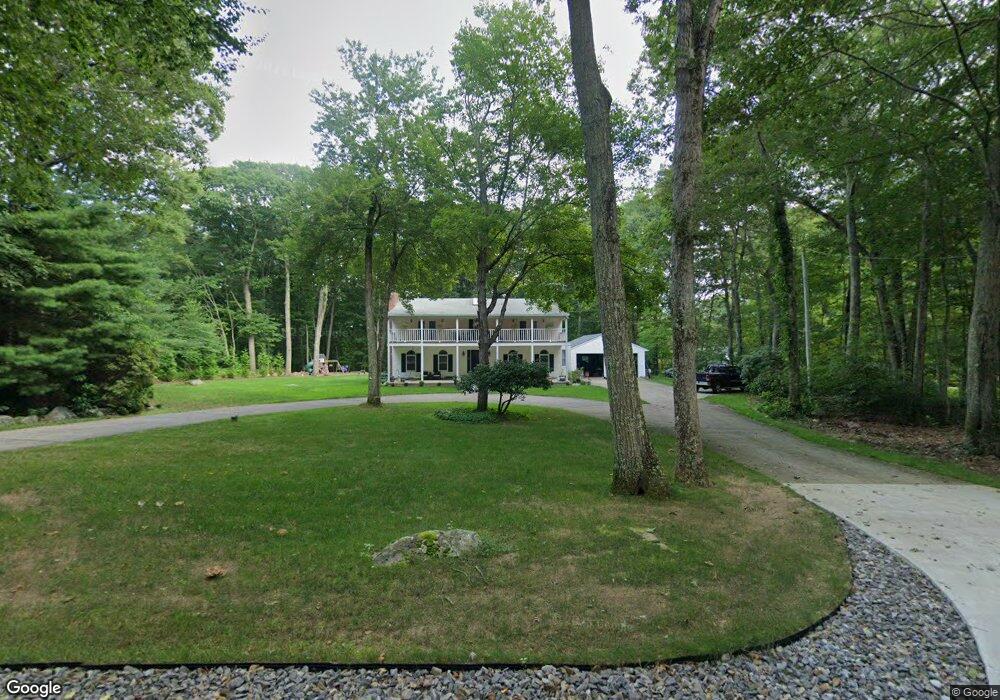
220 Franklin Rd Unit JOHN Coventry, RI 02816
Estimated Value: $632,927 - $839,000
4
Beds
3
Baths
2,592
Sq Ft
$292/Sq Ft
Est. Value
About This Home
This home is located at 220 Franklin Rd Unit JOHN, Coventry, RI 02816 and is currently estimated at $757,232, approximately $292 per square foot. 220 Franklin Rd Unit JOHN is a home located in Kent County with nearby schools including Alan Shawn Feinstein Ms Of Cov and Coventry High School.
Ownership History
Date
Name
Owned For
Owner Type
Purchase Details
Closed on
Mar 26, 2021
Sold by
Grace Tessa I and Grace Kyle D
Bought by
Grace Tessa I and Grace Kyle D
Current Estimated Value
Home Financials for this Owner
Home Financials are based on the most recent Mortgage that was taken out on this home.
Original Mortgage
$247,150
Outstanding Balance
$220,323
Interest Rate
2.9%
Mortgage Type
New Conventional
Estimated Equity
$536,909
Purchase Details
Closed on
Jun 30, 2017
Sold by
Buttery David J and Buttery Linda M
Bought by
Grace Kyle D and Kheradi Tessa
Home Financials for this Owner
Home Financials are based on the most recent Mortgage that was taken out on this home.
Original Mortgage
$255,000
Interest Rate
3.75%
Mortgage Type
New Conventional
Purchase Details
Closed on
Jul 18, 1995
Sold by
Guthrie Joseph J and Guthrie Deborah
Bought by
Buttery David J and Buttery Linda
Create a Home Valuation Report for This Property
The Home Valuation Report is an in-depth analysis detailing your home's value as well as a comparison with similar homes in the area
Purchase History
| Date | Buyer | Sale Price | Title Company |
|---|---|---|---|
| Grace Tessa I | -- | None Available | |
| Grace Kyle D | $355,000 | -- | |
| Buttery David J | $207,000 | -- |
Source: Public Records
Mortgage History
| Date | Status | Borrower | Loan Amount |
|---|---|---|---|
| Open | Grace Tessa I | $247,150 | |
| Previous Owner | Buttery David J | $255,000 | |
| Previous Owner | Buttery David J | $75,000 | |
| Previous Owner | Buttery David J | $241,913 |
Source: Public Records
Tax History
| Year | Tax Paid | Tax Assessment Tax Assessment Total Assessment is a certain percentage of the fair market value that is determined by local assessors to be the total taxable value of land and additions on the property. | Land | Improvement |
|---|---|---|---|---|
| 2025 | $8,006 | $497,600 | $170,700 | $326,900 |
| 2024 | $8,015 | $506,000 | $170,700 | $335,300 |
| 2023 | $7,757 | $506,000 | $170,700 | $335,300 |
| 2022 | $7,417 | $379,000 | $153,200 | $225,800 |
| 2021 | $7,353 | $379,000 | $153,200 | $225,800 |
| 2020 | $8,429 | $379,000 | $153,200 | $225,800 |
| 2019 | $7,468 | $335,800 | $130,100 | $205,700 |
| 2018 | $7,257 | $335,800 | $130,100 | $205,700 |
| 2017 | $7,045 | $335,800 | $130,100 | $205,700 |
| 2016 | $6,971 | $325,600 | $123,100 | $202,500 |
| 2015 | $6,782 | $325,600 | $123,100 | $202,500 |
| 2014 | $6,642 | $325,600 | $123,100 | $202,500 |
| 2013 | $6,820 | $365,500 | $150,900 | $214,600 |
Source: Public Records
Map
Nearby Homes
- 120 Pig Hill Rd
- 370 Maple Valley Rd
- 0 Hollywood Ave
- 30 Hollywood Ave
- 1 Bowen Hill Rd
- 233 Sisson Rd
- 94 Susan Bowen Rd
- 0 Victory Hwy
- 145 Phillips Hill Rd
- 1663 Victory Hwy
- 40 Hicks Way
- 281 Richardson Rd
- 34 Hicks Way
- 26 Acres of Pine Rd
- 0 Poor Farm Lot 67 Rd
- 54 Acres of Pine Rd
- 1398 Harkney Hill Rd
- 260 George Washington Hwy
- 179 Acres of Pine Rd
- 29 Luther Rd
- 220 Franklin Rd Unit HOPE
- 441 Franklin Rd
- 230 Franklin Rd Unit HOPE
- 210 Franklin Rd Unit JOHN
- 480 Franklin Rd
- 434 Franklin Rd
- 188 John Franklin Rd
- 446 Franklin Rd
- 494 Franklin Rd
- 424 Franklin Rd
- 514 Franklin Rd
- 250 Franklin Rd Unit HOPE
- 412 Franklin Rd
- 415 Franklin Rd
- 188 Franklin Rd Unit JOHN
- 503 Franklin Rd
- 185 Franklin Rd Unit HOPE
- 404 Franklin Rd
- 552 Franklin Rd Unit HOPE
- 552 Franklin Rd
Your Personal Tour Guide
Ask me questions while you tour the home.