Estimated Value: $351,000 - $372,000
3
Beds
2
Baths
2,201
Sq Ft
$164/Sq Ft
Est. Value
About This Home
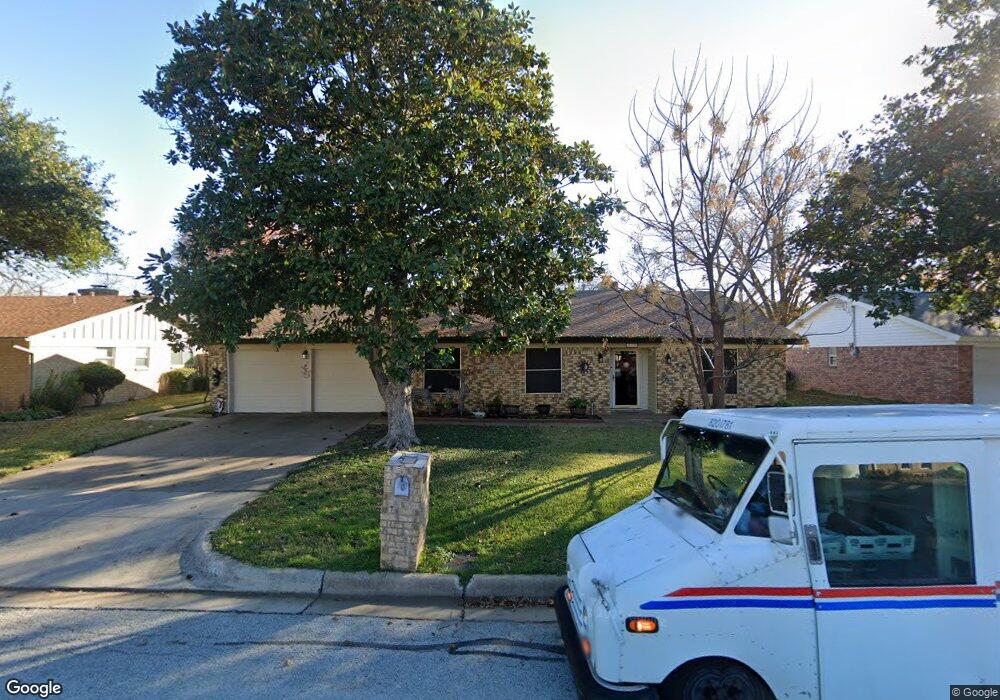
This home is located at 220 Glenn Dr, Hurst, TX 76053 and is currently estimated at $360,893, approximately $163 per square foot. 220 Glenn Dr is a home located in Tarrant County with nearby schools including Jack C Binion Elementary School, Richland Middle School, and Birdville High School.
Ownership History
Date
Name
Owned For
Owner Type
Purchase Details
Closed on
Jul 15, 2014
Sold by
Hutchison Daniel S and Hutchison Rebekah
Bought by
Duhon David and Duhon Sandra
Current Estimated Value
Home Financials for this Owner
Home Financials are based on the most recent Mortgage that was taken out on this home.
Original Mortgage
$129,150
Outstanding Balance
$98,411
Interest Rate
4.17%
Mortgage Type
New Conventional
Estimated Equity
$262,482
Purchase Details
Closed on
Oct 3, 2003
Sold by
Franklin Stanley Powell
Bought by
Hutchison Daniel S and Hutchison Rebekah
Home Financials for this Owner
Home Financials are based on the most recent Mortgage that was taken out on this home.
Original Mortgage
$104,000
Interest Rate
6.25%
Mortgage Type
Purchase Money Mortgage
Purchase Details
Closed on
Nov 1, 1994
Sold by
Franklin Barbara Jean
Bought by
Franklin Smead Powell
Purchase Details
Closed on
Aug 1, 1994
Sold by
Drake John B and Drake Martha Frost
Bought by
Franklin Paul S and Franklin Barbara J
Create a Home Valuation Report for This Property
The Home Valuation Report is an in-depth analysis detailing your home's value as well as a comparison with similar homes in the area
Home Values in the Area
Average Home Value in this Area
Purchase History
| Date | Buyer | Sale Price | Title Company |
|---|---|---|---|
| Duhon David | -- | Fnt | |
| Hutchison Daniel S | -- | Commonwealth Land Title | |
| Franklin Smead Powell | -- | -- | |
| Franklin Paul S | -- | -- |
Source: Public Records
Mortgage History
| Date | Status | Borrower | Loan Amount |
|---|---|---|---|
| Open | Duhon David | $129,150 | |
| Previous Owner | Hutchison Daniel S | $104,000 | |
| Closed | Hutchison Daniel S | $10,000 |
Source: Public Records
Tax History Compared to Growth
Tax History
| Year | Tax Paid | Tax Assessment Tax Assessment Total Assessment is a certain percentage of the fair market value that is determined by local assessors to be the total taxable value of land and additions on the property. | Land | Improvement |
|---|---|---|---|---|
| 2025 | $4,441 | $271,430 | $69,000 | $202,430 |
| 2024 | $4,441 | $271,430 | $69,000 | $202,430 |
| 2023 | $6,015 | $277,442 | $57,200 | $220,242 |
| 2022 | $5,915 | $243,337 | $57,256 | $186,081 |
| 2021 | $5,642 | $217,502 | $50,000 | $167,502 |
| 2020 | $6,266 | $243,837 | $50,000 | $193,837 |
| 2019 | $5,861 | $254,548 | $50,000 | $204,548 |
| 2018 | $4,729 | $202,711 | $25,000 | $177,711 |
| 2017 | $4,917 | $188,110 | $25,000 | $163,110 |
| 2016 | $4,470 | $182,677 | $25,000 | $157,677 |
| 2015 | $3,685 | $152,300 | $20,000 | $132,300 |
| 2014 | $3,685 | $152,300 | $20,000 | $132,300 |
Source: Public Records
Map
Nearby Homes
- 228 Arcadia St
- 1200 Walker Dr
- 1361 Kathryn Ct
- 1304 W Redbud Dr
- 8105 Winter Falls Trail
- 1112 Blakey Ct
- 8308 Fall Crest Dr
- 8129 Trinity Vista Trail
- 405 Billy Creek Cir
- 632 Melbourne Ct
- 512 Billie Ruth Ln
- 3629 Landy Ln
- 8216 Snow Goose Way
- 649 Timberline Dr
- 821 Cullum Ct
- 425 Moore Creek Rd
- 3216 Fountain Pkwy
- 3712 Scranton Dr
- 8528 Mystic Trail
- 4209 Ashmore Dr