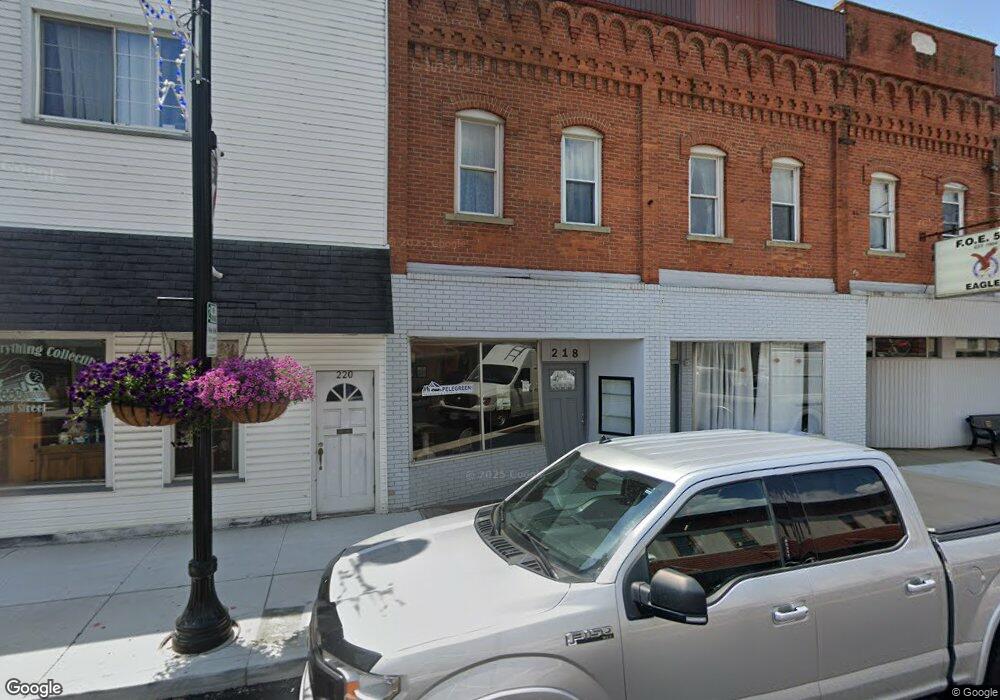
220 Grant St Dennison, OH 44621
Studio
--
Bath
5,816
Sq Ft
6,229
Sq Ft Lot
About This Home
This home is located at 220 Grant St, Dennison, OH 44621. 220 Grant St is a home located in Tuscarawas County with nearby schools including Claymont High School and Immaculate Conception School.
Ownership History
Date
Name
Owned For
Owner Type
Purchase Details
Closed on
Feb 7, 2020
Sold by
Olisa Properties Llc
Bought by
Budavich Peter W
Home Financials for this Owner
Home Financials are based on the most recent Mortgage that was taken out on this home.
Original Mortgage
$40,000
Outstanding Balance
$27,651
Interest Rate
3.74%
Mortgage Type
Future Advance Clause Open End Mortgage
Purchase Details
Closed on
Sep 28, 2015
Sold by
Pangrazio Joseph L
Bought by
Olisa Properties Llc
Home Financials for this Owner
Home Financials are based on the most recent Mortgage that was taken out on this home.
Original Mortgage
$120,000
Interest Rate
3.11%
Mortgage Type
Future Advance Clause Open End Mortgage
Purchase Details
Closed on
Aug 23, 2013
Sold by
Pangrazio Jospeh L
Bought by
Pangrazio Joseph L
Purchase Details
Closed on
May 10, 2007
Sold by
Pangrazio Joseph and Pangrazio Hazel
Bought by
Pangrazio Joseph L and Pangrazio Hazel M
Create a Home Valuation Report for This Property
The Home Valuation Report is an in-depth analysis detailing your home's value as well as a comparison with similar homes in the area
Home Values in the Area
Average Home Value in this Area
Purchase History
| Date | Buyer | Sale Price | Title Company |
|---|---|---|---|
| Budavich Peter W | $50,000 | Alban Title | |
| Olisa Properties Llc | $120,000 | None Available | |
| Pangrazio Joseph L | -- | None Available | |
| Pangrazio Joseph L | -- | Attorney |
Source: Public Records
Mortgage History
| Date | Status | Borrower | Loan Amount |
|---|---|---|---|
| Open | Budavich Peter W | $40,000 | |
| Previous Owner | Olisa Properties Llc | $120,000 |
Source: Public Records
Tax History
| Year | Tax Paid | Tax Assessment Tax Assessment Total Assessment is a certain percentage of the fair market value that is determined by local assessors to be the total taxable value of land and additions on the property. | Land | Improvement |
|---|---|---|---|---|
| 2024 | $1,057 | $68,220 | $11,500 | $56,720 |
| 2023 | $1,057 | $68,220 | $11,500 | $56,720 |
| 2022 | $1,059 | $23,877 | $4,025 | $19,852 |
| 2021 | $995 | $21,000 | $2,576 | $18,424 |
| 2020 | $1,614 | $33,565 | $2,576 | $30,989 |
| 2019 | $1,572 | $33,565 | $2,576 | $30,989 |
| 2018 | $1,619 | $33,570 | $2,580 | $30,990 |
| 2017 | $1,659 | $33,570 | $2,580 | $30,990 |
| 2016 | $1,654 | $33,570 | $2,580 | $30,990 |
| 2014 | $1,462 | $28,190 | $2,630 | $25,560 |
| 2013 | $1,470 | $28,190 | $2,630 | $25,560 |
Source: Public Records
Map
Nearby Homes
Your Personal Tour Guide
Ask me questions while you tour the home.