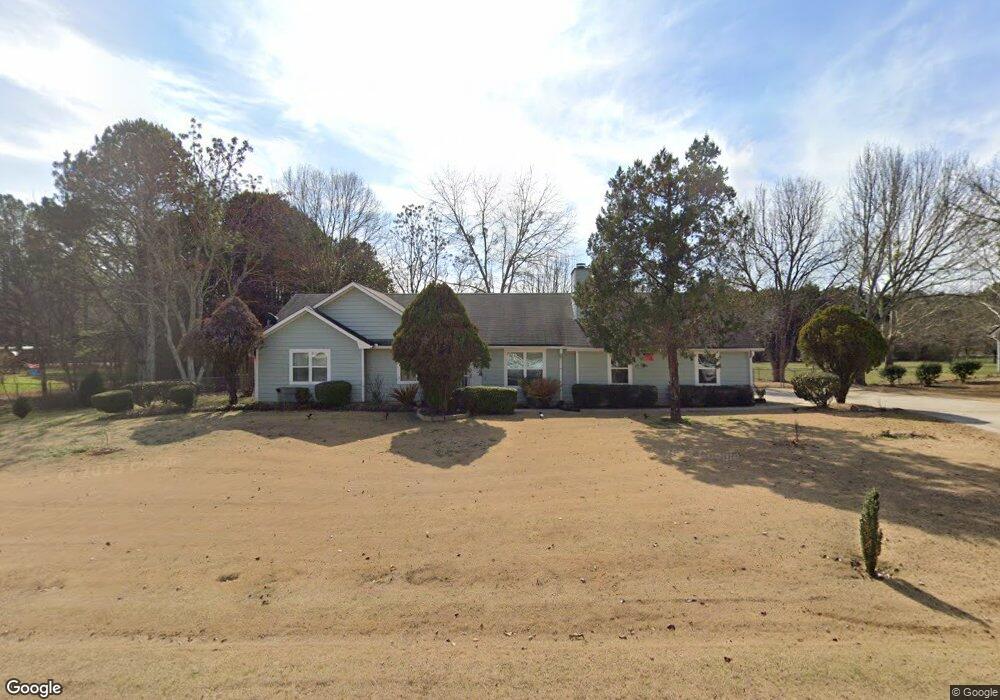
220 Graystone Dr Covington, GA 30014
Estimated Value: $251,000 - $288,000
Studio
2
Baths
1,357
Sq Ft
$200/Sq Ft
Est. Value
About This Home
This home is located at 220 Graystone Dr, Covington, GA 30014 and is currently estimated at $270,746, approximately $199 per square foot. 220 Graystone Dr is a home located in Newton County with nearby schools including East Newton Elementary School, Indian Creek Middle School, and Eastside High School.
Ownership History
Date
Name
Owned For
Owner Type
Purchase Details
Closed on
May 4, 2016
Sold by
Conley Glenn R
Bought by
Saenz Saenz Benito L Benito L and Saenz Arreola Auxilio A
Current Estimated Value
Purchase Details
Closed on
Sep 30, 2005
Sold by
Kaiser Joan
Bought by
Conley Gelnn R and Conley Joyce
Home Financials for this Owner
Home Financials are based on the most recent Mortgage that was taken out on this home.
Original Mortgage
$93,600
Interest Rate
5.71%
Mortgage Type
New Conventional
Purchase Details
Closed on
May 4, 1999
Sold by
Edwards Michael K and Edwards Stephanie L
Bought by
Kaiser Marvin E and Kaiser Joan
Home Financials for this Owner
Home Financials are based on the most recent Mortgage that was taken out on this home.
Original Mortgage
$60,000
Interest Rate
6.98%
Mortgage Type
New Conventional
Purchase Details
Closed on
Jul 14, 1995
Sold by
Hildeshelm Fred G
Bought by
Edwards Michael Stephanie
Create a Home Valuation Report for This Property
The Home Valuation Report is an in-depth analysis detailing your home's value as well as a comparison with similar homes in the area
Home Values in the Area
Average Home Value in this Area
Purchase History
We collect this data history from publicly available records. To have your information removed, we recommend requesting removal directly through your county’s website.
| Date | Buyer | Sale Price | Title Company |
|---|---|---|---|
| Saenz Saenz Benito L Benito L | -- | -- | |
| Conley Gelnn R | $117,000 | -- | |
| Kaiser Marvin E | $93,200 | -- | |
| Edwards Michael Stephanie | $3,400 | -- |
Source: Public Records
Mortgage History
We collect this data history from publicly available records. To have your information removed, we recommend requesting removal directly through your county’s website.
| Date | Status | Borrower | Loan Amount |
|---|---|---|---|
| Previous Owner | Conley Gelnn R | $93,600 | |
| Previous Owner | Kaiser Marvin E | $60,000 | |
| Closed | Edwards Michael Stephanie | $0 |
Source: Public Records
Tax History
| Year | Tax Paid | Tax Assessment Tax Assessment Total Assessment is a certain percentage of the fair market value that is determined by local assessors to be the total taxable value of land and additions on the property. | Land | Improvement |
|---|---|---|---|---|
| 2025 | $2,687 | $106,640 | $14,800 | $91,840 |
| 2024 | $2,533 | $98,680 | $14,800 | $83,880 |
| 2023 | $2,282 | $82,880 | $9,400 | $73,480 |
| 2022 | $1,947 | $70,520 | $9,400 | $61,120 |
| 2021 | $1,712 | $55,360 | $9,400 | $45,960 |
| 2020 | $1,716 | $50,160 | $9,400 | $40,760 |
| 2019 | $1,764 | $50,840 | $9,400 | $41,440 |
| 2018 | $860 | $49,200 | $9,400 | $39,800 |
| 2017 | $1,529 | $43,640 | $8,400 | $35,240 |
| 2016 | $1,264 | $35,920 | $7,200 | $28,720 |
| 2015 | $1,282 | $36,520 | $7,200 | $29,320 |
| 2014 | $1,115 | $31,760 | $0 | $0 |
Source: Public Records
Map
Nearby Homes
- 225 Graystone Dr
- 770 Starrsville Rd
- 85 Cambridge Dr
- 95 Cambridge Dr
- 25 Caseys Way
- 115 Rose Creek Dr
- 135 Rose Creek Dr
- 170 Rose Creek Dr
- 155 Rose Creek Dr
- 2628 Elks Club Rd
- 20 Balfour Dr
- 25 Hornbeam Way
- 165 Glengarry Chase
- 135 Dixie Ln
- 40 Hollyhock Ln
- 80 Rock Rose Dr
- 0 Adams Rd Unit 7685218
- 0 Adams Rd Unit 7685226
- 0 Adams Rd Unit TRACT 5
- 0 Adams Rd Unit TRACT 4
- 210 Graystone Dr
- 230 Graystone Dr
- 215 Graystone Dr
- 200 Graystone Dr
- 195 Graystone Dr
- 2464 Dixie Rd
- 2472 Dixie Rd
- 190 Graystone Dr
- 185 Graystone Dr
- 2484 Dixie Rd
- 10 Cambridge Dr
- 15 Graystone Dr
- 180 Graystone Dr
- 2476 Dixie Rd
- 175 Graystone Dr
- 25 Graystone Dr
- 2500 Dixie Rd
- 2506 Dixie Rd
- 20 Cambridge Dr
- 2494 Dixie Rd
Your Personal Tour Guide
Ask me questions while you tour the home.