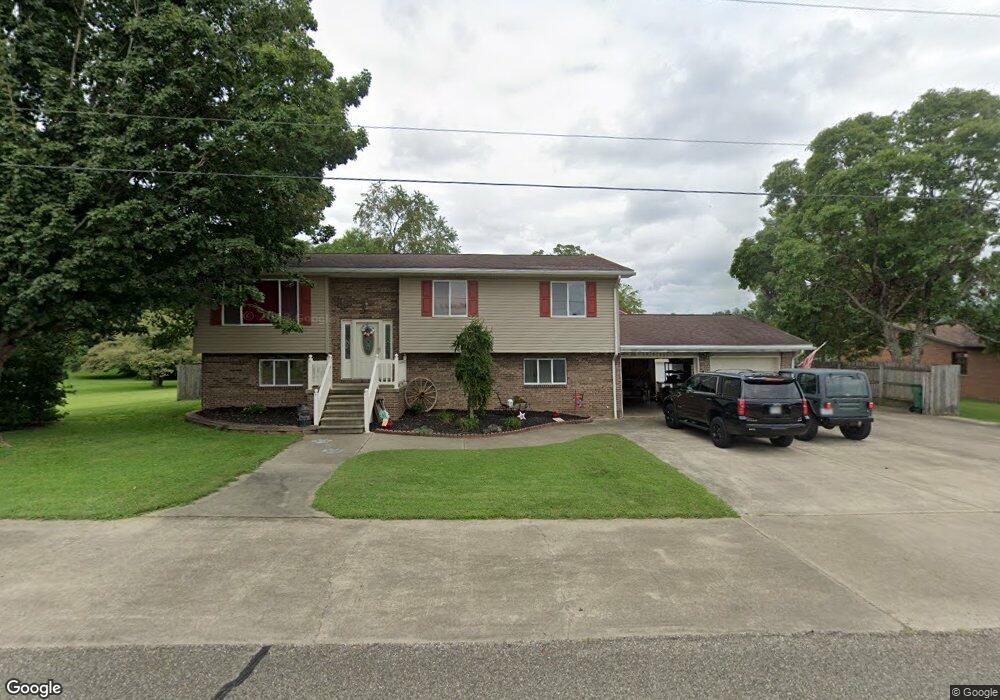
220 Hendricks St Newport, OH 45768
Estimated Value: $223,000 - $237,000
3
Beds
2
Baths
1,260
Sq Ft
$183/Sq Ft
Est. Value
About This Home
This home is located at 220 Hendricks St, Newport, OH 45768 and is currently estimated at $230,657, approximately $183 per square foot. 220 Hendricks St is a home located in Washington County with nearby schools including North Pleasants Christian School.
Ownership History
Date
Name
Owned For
Owner Type
Purchase Details
Closed on
Jun 22, 2018
Sold by
Arnold Patrick A and Arnold Althea M
Bought by
Rhodes Shannon
Current Estimated Value
Home Financials for this Owner
Home Financials are based on the most recent Mortgage that was taken out on this home.
Original Mortgage
$167,838
Outstanding Balance
$145,546
Interest Rate
4.99%
Mortgage Type
FHA
Estimated Equity
$85,111
Purchase Details
Closed on
Jul 28, 2005
Sold by
Haessly Mack and Haessly Donna
Bought by
Stout Edward J and Stout Jessica L
Home Financials for this Owner
Home Financials are based on the most recent Mortgage that was taken out on this home.
Original Mortgage
$135,000
Interest Rate
5.66%
Mortgage Type
New Conventional
Purchase Details
Closed on
Nov 19, 2002
Bought by
Haessly Mack
Purchase Details
Closed on
Dec 27, 1999
Bought by
Skinner Phillip L and Skinner Shaw
Purchase Details
Closed on
Feb 9, 1988
Create a Home Valuation Report for This Property
The Home Valuation Report is an in-depth analysis detailing your home's value as well as a comparison with similar homes in the area
Purchase History
| Date | Buyer | Sale Price | Title Company |
|---|---|---|---|
| Rhodes Shannon | $172,500 | Title Source Inc | |
| Stout Edward J | $180,000 | None Available | |
| Haessly Mack | $103,000 | -- | |
| Haessly Mack | $103,000 | -- | |
| Skinner Phillip L | $96,000 | -- | |
| Skinner Phillip L | $96,000 | -- | |
| -- | -- | -- | |
| -- | -- | -- |
Source: Public Records
Mortgage History
| Date | Status | Borrower | Loan Amount |
|---|---|---|---|
| Open | Rhodes Shannon | $167,838 | |
| Previous Owner | Stout Edward J | $135,000 |
Source: Public Records
Tax History
| Year | Tax Paid | Tax Assessment Tax Assessment Total Assessment is a certain percentage of the fair market value that is determined by local assessors to be the total taxable value of land and additions on the property. | Land | Improvement |
|---|---|---|---|---|
| 2024 | $2,354 | $66,200 | $5,740 | $60,460 |
| 2023 | $2,191 | $66,200 | $5,740 | $60,460 |
| 2022 | $2,180 | $66,200 | $5,740 | $60,460 |
| 2021 | $2,132 | $61,890 | $3,850 | $58,040 |
| 2020 | $2,241 | $61,890 | $3,850 | $58,040 |
| 2019 | $2,242 | $61,890 | $3,850 | $58,040 |
| 2018 | $3,101 | $58,860 | $3,350 | $55,510 |
| 2017 | $2,194 | $58,860 | $3,350 | $55,510 |
| 2016 | $3,118 | $58,860 | $3,350 | $55,510 |
| 2015 | $1,907 | $51,810 | $3,540 | $48,270 |
| 2014 | $2,752 | $51,810 | $3,540 | $48,270 |
| 2013 | $945 | $51,810 | $3,540 | $48,270 |
Source: Public Records
Map
Nearby Homes
- 160 Poinciana St
- 520 Greene St
- 113 Creel St
- 207 George St
- 611 Riverside Dr
- 310 Barkwill St
- 308 Cherry St
- 200 Ankrom St
- TBD Elk Ave
- 0 Elk Ave
- 169 Kinderhook Ridge Rd
- 705 Sparks Ridge Rd
- 41084 Ohio 7
- 0 N Pleasants Hwy
- 211 Clark St
- 390 Powell Riverfront Rd
- 0 Powell Riverfront Rd
- 518 Riverview Dr
- 168 Kinderhook Ridge Rd
- 606 Pearl St
- 200 Hendricks St
- 260 Hendricks St
- 225 Hendricks St
- 245 Hendricks St
- 215 Hendricks St
- 265 Hendricks St
- 270 Hendricks St
- 195 Hendricks St
- 190 Hendricks St
- 315 Hendricks St
- 285 Hendricks St
- 185 Hendricks St
- 230 Harris St
- 170 Hendricks St
- 260 Harris St
- 220 Harris St
- 165 Hendricks St
- 290 Harris St
- 290 Harris St
- 155 Hendricks St
Your Personal Tour Guide
Ask me questions while you tour the home.