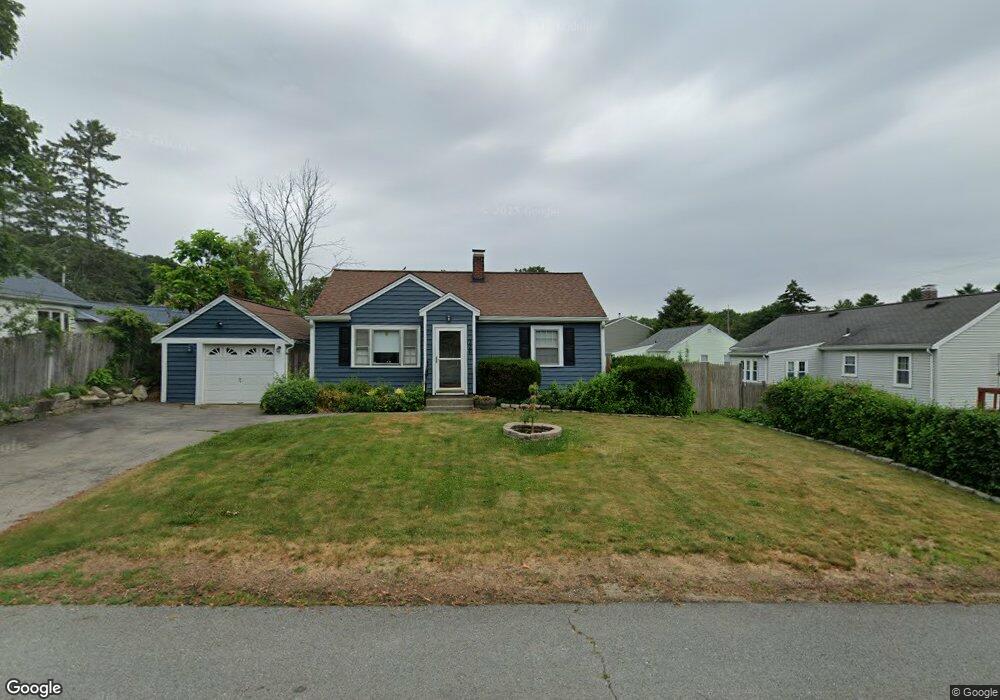
220 Isabelle St Abington, MA 02351
Estimated Value: $394,000 - $476,000
2
Beds
1
Bath
704
Sq Ft
$610/Sq Ft
Est. Value
About This Home
This home is located at 220 Isabelle St, Abington, MA 02351 and is currently estimated at $429,192, approximately $609 per square foot. 220 Isabelle St is a home located in Plymouth County with nearby schools including Beaver Brook Elementary School, Abington Middle School, and Woodsdale School.
Ownership History
Date
Name
Owned For
Owner Type
Purchase Details
Closed on
Nov 15, 2022
Sold by
Duffy Diane E and Duffy John A
Bought by
John Arthur Duffy Lt
Current Estimated Value
Purchase Details
Closed on
May 25, 1994
Sold by
Delaney Roberta A and Delaney Thomas M
Bought by
Duffy John A and Duffy Diane E
Home Financials for this Owner
Home Financials are based on the most recent Mortgage that was taken out on this home.
Original Mortgage
$109,250
Interest Rate
8.22%
Mortgage Type
Purchase Money Mortgage
Create a Home Valuation Report for This Property
The Home Valuation Report is an in-depth analysis detailing your home's value as well as a comparison with similar homes in the area
Home Values in the Area
Average Home Value in this Area
Purchase History
| Date | Buyer | Sale Price | Title Company |
|---|---|---|---|
| John Arthur Duffy Lt | -- | None Available | |
| Duffy John A | $115,000 | -- |
Source: Public Records
Mortgage History
| Date | Status | Borrower | Loan Amount |
|---|---|---|---|
| Previous Owner | Duffy John A | $164,366 | |
| Previous Owner | Duffy John A | $15,358 | |
| Previous Owner | Duffy John A | $109,250 |
Source: Public Records
Tax History Compared to Growth
Tax History
| Year | Tax Paid | Tax Assessment Tax Assessment Total Assessment is a certain percentage of the fair market value that is determined by local assessors to be the total taxable value of land and additions on the property. | Land | Improvement |
|---|---|---|---|---|
| 2025 | $4,422 | $338,600 | $209,900 | $128,700 |
| 2024 | $4,157 | $310,700 | $190,800 | $119,900 |
| 2023 | $4,137 | $291,100 | $165,900 | $125,200 |
| 2022 | $4,003 | $263,000 | $145,100 | $117,900 |
| 2021 | $3,914 | $237,500 | $131,700 | $105,800 |
| 2020 | $4,092 | $240,700 | $138,200 | $102,500 |
| 2019 | $3,701 | $212,800 | $131,700 | $81,100 |
| 2018 | $3,755 | $210,700 | $131,700 | $79,000 |
| 2017 | $3,543 | $193,100 | $131,700 | $61,400 |
| 2016 | $3,267 | $182,200 | $125,400 | $56,800 |
| 2015 | $3,019 | $177,600 | $125,400 | $52,200 |
Source: Public Records
Map
Nearby Homes