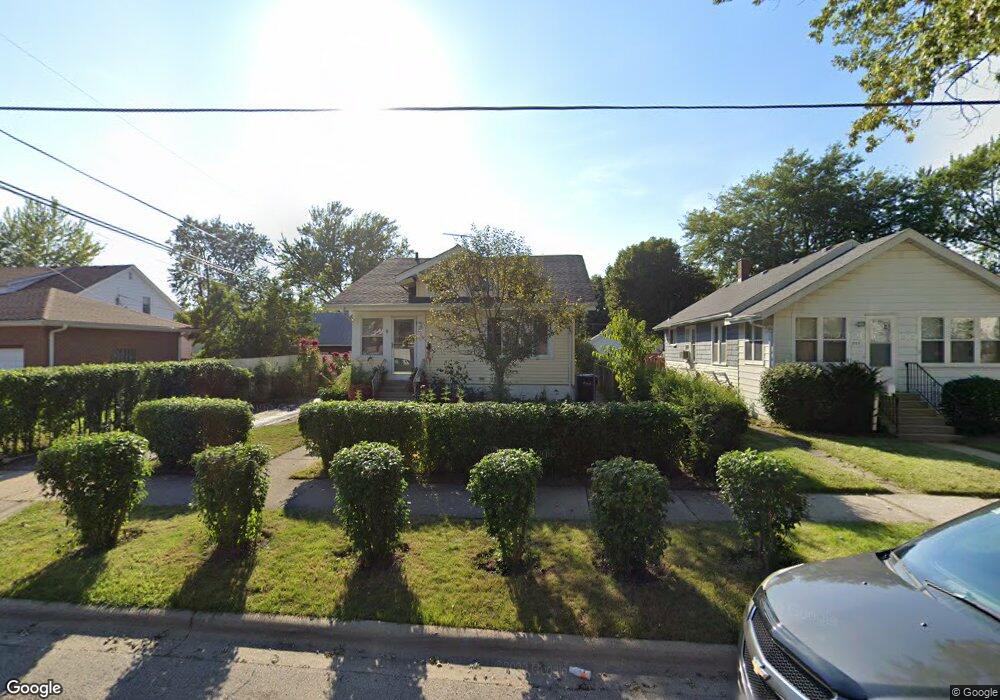
220 Judge Ave Waukegan, IL 60085
West Waukegan NeighborhoodEstimated Value: $215,000 - $277,000
2
Beds
1
Bath
1,215
Sq Ft
$195/Sq Ft
Est. Value
About This Home
This home is located at 220 Judge Ave, Waukegan, IL 60085 and is currently estimated at $237,271, approximately $195 per square foot. 220 Judge Ave is a home located in Lake County with nearby schools including Hyde Park Elementary School, Miguel Juarez Middle School, and Waukegan High School.
Ownership History
Date
Name
Owned For
Owner Type
Purchase Details
Closed on
Jan 31, 2023
Sold by
Castro Manuel Rio
Bought by
Castro Manuel Rio and Derios Maria De
Current Estimated Value
Purchase Details
Closed on
Apr 11, 2008
Sold by
Rios Javier and Castro Manuel Rios
Bought by
Castro Manuel Rios and Rios Maria
Home Financials for this Owner
Home Financials are based on the most recent Mortgage that was taken out on this home.
Original Mortgage
$126,875
Interest Rate
5.93%
Mortgage Type
New Conventional
Purchase Details
Closed on
Aug 29, 2001
Sold by
Bahena Hector V and Santana Celia
Bought by
Rios Castro Manuel and Rios Javier
Home Financials for this Owner
Home Financials are based on the most recent Mortgage that was taken out on this home.
Original Mortgage
$114,187
Interest Rate
6.97%
Mortgage Type
FHA
Create a Home Valuation Report for This Property
The Home Valuation Report is an in-depth analysis detailing your home's value as well as a comparison with similar homes in the area
Home Values in the Area
Average Home Value in this Area
Purchase History
| Date | Buyer | Sale Price | Title Company |
|---|---|---|---|
| Castro Manuel Rio | -- | -- | |
| Castro Manuel Rios | -- | Ticor | |
| Rios Castro Manuel | $116,000 | -- |
Source: Public Records
Mortgage History
| Date | Status | Borrower | Loan Amount |
|---|---|---|---|
| Previous Owner | Castro Manuel Rios | $126,875 | |
| Previous Owner | Rios Castro Manuel | $114,187 |
Source: Public Records
Tax History Compared to Growth
Tax History
| Year | Tax Paid | Tax Assessment Tax Assessment Total Assessment is a certain percentage of the fair market value that is determined by local assessors to be the total taxable value of land and additions on the property. | Land | Improvement |
|---|---|---|---|---|
| 2024 | $3,906 | $55,201 | $8,704 | $46,497 |
| 2023 | $3,752 | $49,422 | $7,793 | $41,629 |
| 2022 | $3,752 | $44,382 | $7,104 | $37,278 |
| 2021 | $3,410 | $38,704 | $6,692 | $32,012 |
| 2020 | $3,407 | $36,057 | $6,234 | $29,823 |
| 2019 | $3,376 | $33,040 | $5,712 | $27,328 |
| 2018 | $3,032 | $29,830 | $6,738 | $23,092 |
| 2017 | $2,901 | $26,391 | $5,961 | $20,430 |
| 2016 | $2,617 | $22,933 | $5,180 | $17,753 |
| 2015 | $2,454 | $20,525 | $4,636 | $15,889 |
| 2014 | $2,701 | $21,501 | $5,104 | $16,397 |
| 2012 | $3,567 | $23,297 | $5,531 | $17,766 |
Source: Public Records
Map
Nearby Homes
- 1416 Hamilton Ct
- 2115 Lydia St
- 23 N Jackson St
- 1213 Grand Ave
- 49 S Lewis Ave
- 1521 Catalpa Ave
- 615 Tiffany Dr
- 824 N Butrick St
- 511 Chestnut St
- 428 N Poplar St
- 1109 Massena Ave
- 28 N Saint James St
- 522 N Poplar St
- 0 Brookside Ave
- 702 Franklin St
- 968 Judge Ave
- 620 N Poplar St
- 917 N Linden Ave
- 1000 Pine St
- 1005 N Lewis Ave
- 224 Judge Ave
- 1606 W Monroe St
- 218 Judge Ave
- 314 Judge Ave
- 1610 W Monroe St
- 301 Lorraine Ave
- 316 Judge Ave
- 1614 W Monroe St
- 303 Lorraine Ave
- 1622 W Monroe St
- 221 Judge Ave
- 305 Lorraine Ave
- 318 Judge Ave
- 225 Judge Ave
- 1534 W Monroe St
- 301 Judge Ave
- 309 Lorraine Ave
- 305 Judge Ave
- 1528 W Monroe St
- 217 Dorchester Ct