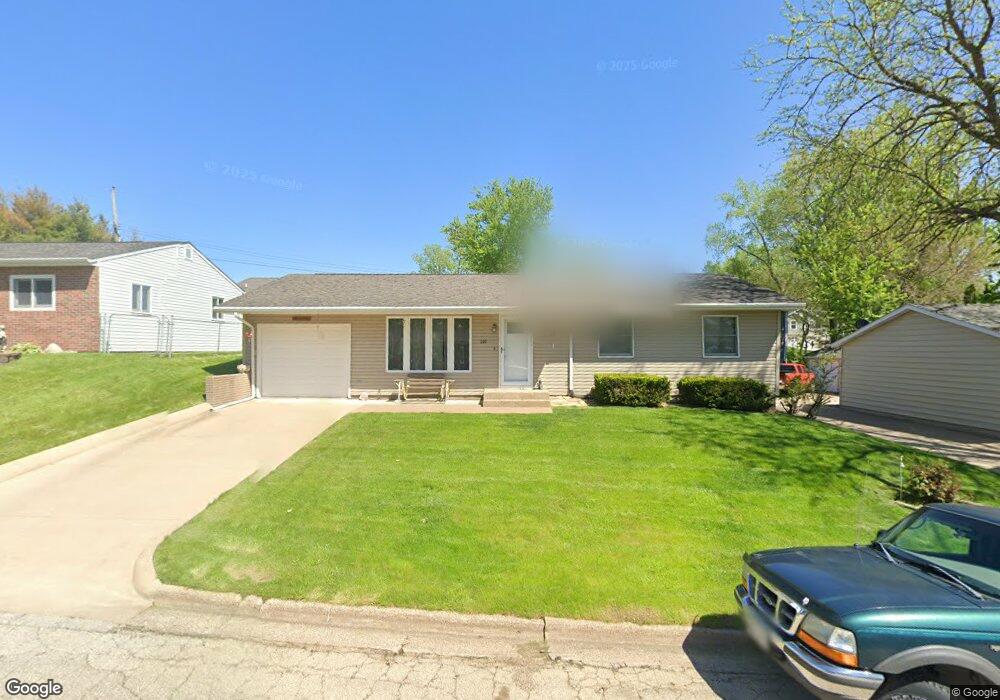
220 Jule Ave East Dubuque, IL 61025
Estimated Value: $160,000 - $350,000
--
Bed
--
Bath
--
Sq Ft
6,534
Sq Ft Lot
About This Home
This home is located at 220 Jule Ave, East Dubuque, IL 61025 and is currently estimated at $259,789. 220 Jule Ave is a home located in Jo Daviess County with nearby schools including East Dubuque Elementary School, East Dubuque Junior High School, and East Dubuque High School.
Create a Home Valuation Report for This Property
The Home Valuation Report is an in-depth analysis detailing your home's value as well as a comparison with similar homes in the area
Home Values in the Area
Average Home Value in this Area
Tax History Compared to Growth
Tax History
| Year | Tax Paid | Tax Assessment Tax Assessment Total Assessment is a certain percentage of the fair market value that is determined by local assessors to be the total taxable value of land and additions on the property. | Land | Improvement |
|---|---|---|---|---|
| 2024 | $2,608 | $52,459 | $6,666 | $45,793 |
| 2023 | $2,265 | $44,756 | $5,075 | $39,681 |
| 2022 | $2,265 | $42,127 | $4,777 | $37,350 |
| 2021 | $1,260 | $42,127 | $4,777 | $37,350 |
| 2020 | $1,283 | $39,814 | $4,515 | $35,299 |
| 2019 | $1,249 | $38,317 | $4,235 | $34,082 |
| 2018 | $1,283 | $34,619 | $3,826 | $30,793 |
| 2017 | $1,259 | $34,619 | $3,826 | $30,793 |
| 2016 | $1,239 | $31,807 | $3,515 | $28,292 |
| 2015 | $1,276 | $29,723 | $3,285 | $26,438 |
| 2014 | $1,332 | $31,668 | $3,500 | $28,168 |
Source: Public Records
Map
Nearby Homes
- 8891 N Badger Rd
- 405 N Blake Ave
- Lot 17 W Michelle Ct
- 1420 Hiawatha Dr
- Lot 1 Wolff Ln
- 527 Badger Rd
- Lot 2 Wolff Ln
- 1045 Hiawatha Dr
- 351 Wisconsin Ave
- 380 Sherwood Ave
- 19400 U S 20
- 165 Copper Kettle Ln
- 167 Sinsinawa Ave
- 436 Desoto Ave
- 422 Wyota Ave
- 0 Truman Dr
- Lot 46 W Mississippi Dr
- Lot 41 W Mississippi Dr
- Lot 44 W Mississippi Dr
- Lot 42 W Mississippi Dr