220 Kitson Rd Winfield, MO 63389
Estimated payment $5,636/month
Total Views
33,814
74
Acres
$14,189
Price per Acre
3,223,440
Sq Ft Lot
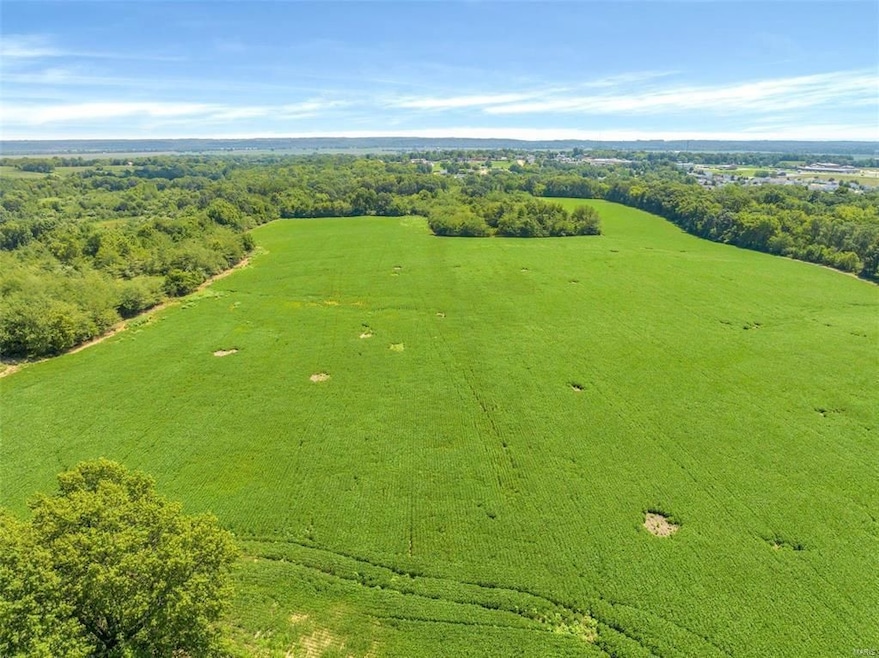
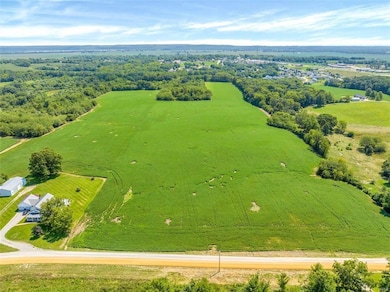
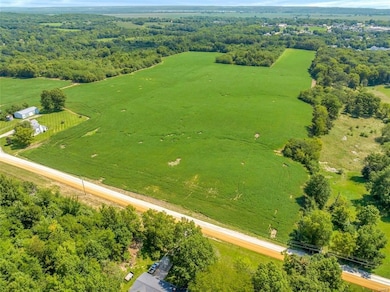
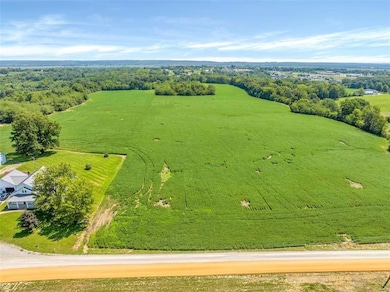
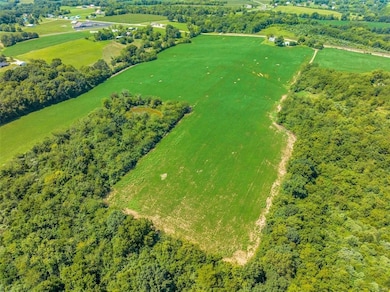
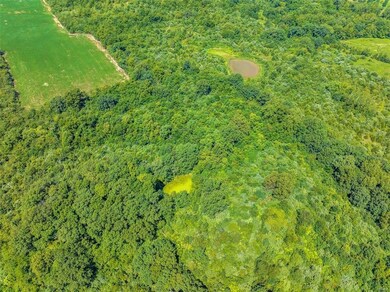
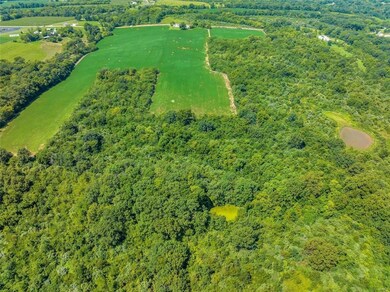
About This Lot
Welcome to the rolling hills of Lincoln county! Tired of the hustle and bustle of the city? This beautiful piece of land is your own little oasis with spectacular views, abundant wildlife and the peacefulness you have been craving, all just minutes from St. Charles county. Calling all builders, this 74.69 acre tract has already been annexed into the City of Winfield. There is currently a verbal share crop agreement in place for the year 2024 with the potential to continue if you are looking for an income generating property as well. The possibilities are endless!
Listing Provided By

Property Details
Property Type
- Land
Lot Details
- Few Trees
- Current uses include row crop
- Potential uses include agriculture, residential single, for development
Additional Features
- Pond
- Easements include utilities
- Horses Allowed On Property
Map
Create a Home Valuation Report for This Property
The Home Valuation Report is an in-depth analysis detailing your home's value as well as a comparison with similar homes in the area
Tax History
| Year | Tax Paid | Tax Assessment Tax Assessment Total Assessment is a certain percentage of the fair market value that is determined by local assessors to be the total taxable value of land and additions on the property. | Land | Improvement |
|---|---|---|---|---|
| 2025 | $376 | $8,791 | $8,791 | $0 |
| 2024 | $1,869 | $32,642 | $8,477 | $24,165 |
| 2023 | $1,878 | $36,586 | $11,926 | $24,660 |
| 2022 | $1,781 | $31,193 | $8,477 | $22,716 |
| 2021 | $1,791 | $135,561 | $0 | $0 |
| 2020 | $1,520 | $114,561 | $0 | $0 |
| 2019 | $1,522 | $114,561 | $0 | $0 |
| 2018 | $1,538 | $27,128 | $0 | $0 |
| 2017 | $1,543 | $27,128 | $0 | $0 |
| 2016 | $1,433 | $24,630 | $0 | $0 |
| 2015 | $1,439 | $24,630 | $0 | $0 |
| 2014 | $1,411 | $24,423 | $0 | $0 |
| 2013 | -- | $24,423 | $0 | $0 |
Source: Public Records
Property History
| Date | Event | Price | List to Sale | Price per Sq Ft |
|---|---|---|---|---|
| 12/20/2023 12/20/23 | For Sale | $1,049,999 | -- | -- |
Purchase History
| Date | Type | Sale Price | Title Company |
|---|---|---|---|
| Joint Tenancy Deed | -- | None Available |
Source: Public Records
Nearby Homes
- 431 Peregrine Ct
- E Highway 47 E State Highway 47
- Lot #21 West Ave
- 350 Birkhead Rd
- 671 Birkhead Rd
- 25 Rolfes Ln
- 0 Pillsbury Rd
- 35 Woodline Dr
- 55 Lake Bend Dr
- 757 Birkhead Rd
- 69 Walnut Grove Dr
- 3 Winfield Plaza
- 845 Highway Ee
- 00 Pillsbury Rd
- 485 Pillsbury Rd
- 329 Lakeview Rd
- 74 Ackerman Ct
- 280 Sycamore Ln
- 213 Lincoln Ln
- 619 N Ethlyn Rd
- 223 Main St
- 223 Main St
- 1702 Rivercroft Dr
- 231 Truman Ct
- 4 Santo Domingo Dr
- 4 Quail Run Cir
- 213 Deer Hollow Ct
- 16 Homefield Gardens Dr Unit 20N
- 2010 Peine Rd
- 120 Champions Ln
- 232 Amber Crest Dr
- 322 Aspen Creek Dr
- 246 Lonepine Dr
- 314 Heather Mill Dr
- 100 Dry Brook Rd
- 6000-9000 Boone Street Commons Ct
- 518 Pleasant Breeze Dr
- 200 Casalon Pkwy
- 405 Montbrook Dr
- 310 Rustic Oaks Dr
Your Personal Tour Guide
Ask me questions while you tour the home.