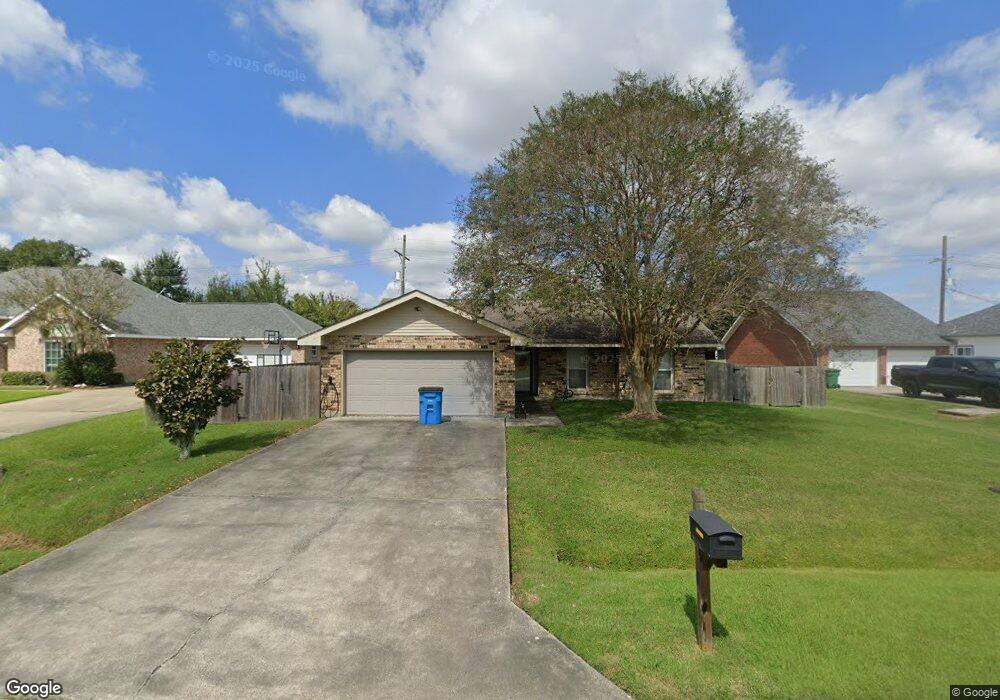
220 Laurel Ct Luling, LA 70070
Estimated Value: $243,000 - $335,000
3
Beds
2
Baths
1,576
Sq Ft
$180/Sq Ft
Est. Value
About This Home
This home is located at 220 Laurel Ct, Luling, LA 70070 and is currently estimated at $283,785, approximately $180 per square foot. 220 Laurel Ct is a home located in St. Charles Parish with nearby schools including Mimosa Park Elementary School, Lakewood Elementary School, and J.B. Martin Middle School.
Ownership History
Date
Name
Owned For
Owner Type
Purchase Details
Closed on
Apr 26, 2013
Sold by
Us Bank Na
Bought by
Bennett Evelyn Ford and Bennett Evelyn
Current Estimated Value
Home Financials for this Owner
Home Financials are based on the most recent Mortgage that was taken out on this home.
Original Mortgage
$132,600
Outstanding Balance
$92,774
Interest Rate
3.58%
Mortgage Type
New Conventional
Estimated Equity
$191,011
Purchase Details
Closed on
Oct 21, 2005
Sold by
Hill Thomas A and Hill Carol Mazul
Bought by
Williams Langston D
Home Financials for this Owner
Home Financials are based on the most recent Mortgage that was taken out on this home.
Original Mortgage
$26,250
Interest Rate
5.75%
Mortgage Type
Stand Alone Second
Create a Home Valuation Report for This Property
The Home Valuation Report is an in-depth analysis detailing your home's value as well as a comparison with similar homes in the area
Home Values in the Area
Average Home Value in this Area
Purchase History
| Date | Buyer | Sale Price | Title Company |
|---|---|---|---|
| Bennett Evelyn Ford | $169,000 | Crescent Title Llc | |
| Williams Langston D | $175,000 | Title Management Group Inc |
Source: Public Records
Mortgage History
| Date | Status | Borrower | Loan Amount |
|---|---|---|---|
| Open | Bennett Evelyn Ford | $132,600 | |
| Previous Owner | Williams Langston D | $26,250 | |
| Previous Owner | Williams Langston D | $148,750 |
Source: Public Records
Tax History
| Year | Tax Paid | Tax Assessment Tax Assessment Total Assessment is a certain percentage of the fair market value that is determined by local assessors to be the total taxable value of land and additions on the property. | Land | Improvement |
|---|---|---|---|---|
| 2025 | $1,590 | $23,230 | $8,130 | $15,100 |
| 2024 | $1,590 | $23,230 | $8,130 | $15,100 |
| 2023 | $1,615 | $17,390 | $7,320 | $10,070 |
| 2022 | $2,034 | $17,390 | $7,320 | $10,070 |
| 2021 | $1,846 | $15,651 | $6,588 | $9,063 |
| 2020 | $2,055 | $17,390 | $7,320 | $10,070 |
| 2019 | $1,903 | $16,046 | $5,035 | $11,011 |
| 2018 | $1,888 | $16,046 | $5,035 | $11,011 |
| 2017 | $1,886 | $16,046 | $5,035 | $11,011 |
| 2016 | $1,894 | $16,046 | $5,035 | $11,011 |
| 2015 | $993 | $15,946 | $3,869 | $12,077 |
| 2014 | $957 | $15,946 | $3,869 | $12,077 |
| 2013 | $960 | $15,946 | $3,869 | $12,077 |
Source: Public Records
Map
Nearby Homes
Your Personal Tour Guide
Ask me questions while you tour the home.