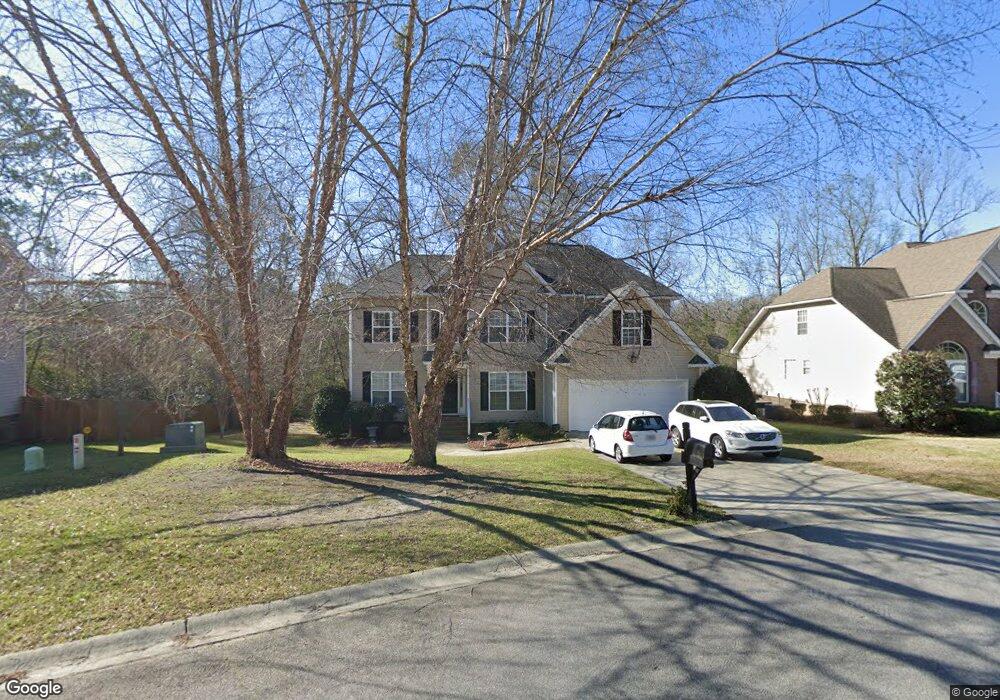
220 Letha Ln Lexington, SC 29072
Estimated Value: $399,843 - $437,000
4
Beds
3
Baths
2,689
Sq Ft
$157/Sq Ft
Est. Value
About This Home
This home is located at 220 Letha Ln, Lexington, SC 29072 and is currently estimated at $423,211, approximately $157 per square foot. 220 Letha Ln is a home located in Lexington County with nearby schools including Lake Murray Elementary School, Beechwood Middle School, and Lexington High School.
Ownership History
Date
Name
Owned For
Owner Type
Purchase Details
Closed on
Aug 24, 2016
Sold by
Abrams John K and Abrams Linda R
Bought by
Abrams John Keith and Abrams Linda R
Current Estimated Value
Purchase Details
Closed on
Jul 27, 2015
Sold by
B & B Real Estate Investors Llc
Bought by
Abrams John K and Abrams Linda R
Purchase Details
Closed on
Apr 24, 2015
Sold by
Deutsche Bank National Trust Company
Bought by
B & B Real Estate Investors Llc
Purchase Details
Closed on
Feb 2, 2015
Sold by
Massinnello Joseph C and Massinnello Diana R
Bought by
Deutsche Bank National Trust Company
Purchase Details
Closed on
Nov 13, 2006
Sold by
Essex Homes Southeast Inc
Bought by
Massinello Joseph C and Massinello Diana R
Home Financials for this Owner
Home Financials are based on the most recent Mortgage that was taken out on this home.
Original Mortgage
$194,705
Interest Rate
7.87%
Mortgage Type
Adjustable Rate Mortgage/ARM
Create a Home Valuation Report for This Property
The Home Valuation Report is an in-depth analysis detailing your home's value as well as a comparison with similar homes in the area
Home Values in the Area
Average Home Value in this Area
Purchase History
| Date | Buyer | Sale Price | Title Company |
|---|---|---|---|
| Abrams John Keith | -- | None Available | |
| Abrams John K | $231,500 | -- | |
| B & B Real Estate Investors Llc | $165,000 | -- | |
| Deutsche Bank National Trust Company | $192,782 | -- | |
| Massinello Joseph C | $245,000 | None Available |
Source: Public Records
Mortgage History
| Date | Status | Borrower | Loan Amount |
|---|---|---|---|
| Previous Owner | Massinello Joseph C | $194,705 |
Source: Public Records
Tax History Compared to Growth
Tax History
| Year | Tax Paid | Tax Assessment Tax Assessment Total Assessment is a certain percentage of the fair market value that is determined by local assessors to be the total taxable value of land and additions on the property. | Land | Improvement |
|---|---|---|---|---|
| 2024 | $1,036 | $9,766 | $1,580 | $8,186 |
| 2023 | $1,036 | $9,766 | $1,580 | $8,186 |
| 2020 | $1,079 | $9,766 | $1,580 | $8,186 |
| 2019 | $1,021 | $9,260 | $1,400 | $7,860 |
| 2018 | $1,003 | $9,260 | $1,400 | $7,860 |
| 2017 | $965 | $9,260 | $1,400 | $7,860 |
| 2016 | $966 | $9,260 | $1,400 | $7,860 |
| 2014 | -- | $9,964 | $1,400 | $8,564 |
| 2013 | -- | $9,960 | $1,400 | $8,560 |
Source: Public Records
Map
Nearby Homes
- 313 Oneil Ln
- 337 Scarborough Ln
- 190 Grey Oaks Ln
- 612 Dawsons Park Way
- 744 Dawsons Park Way
- 760 Dawsons Park Way
- 606 Meadow Grass Ln
- 817 Dawsons Park Way
- 214 Scarborough Way
- 104 Cottingham Ct
- 510 Dawsons Park Way
- 529 Meadow Grass Ln
- 218 Horse Farm Place
- 222 Horse Farm Place
- 405 Nutsedge Ct
- 226 Horse Farm Place
- 234 Horse Farm Place
- 238 Horse Farm Place
- 225 Horse Farm Place
- 242 Horse Farm Place