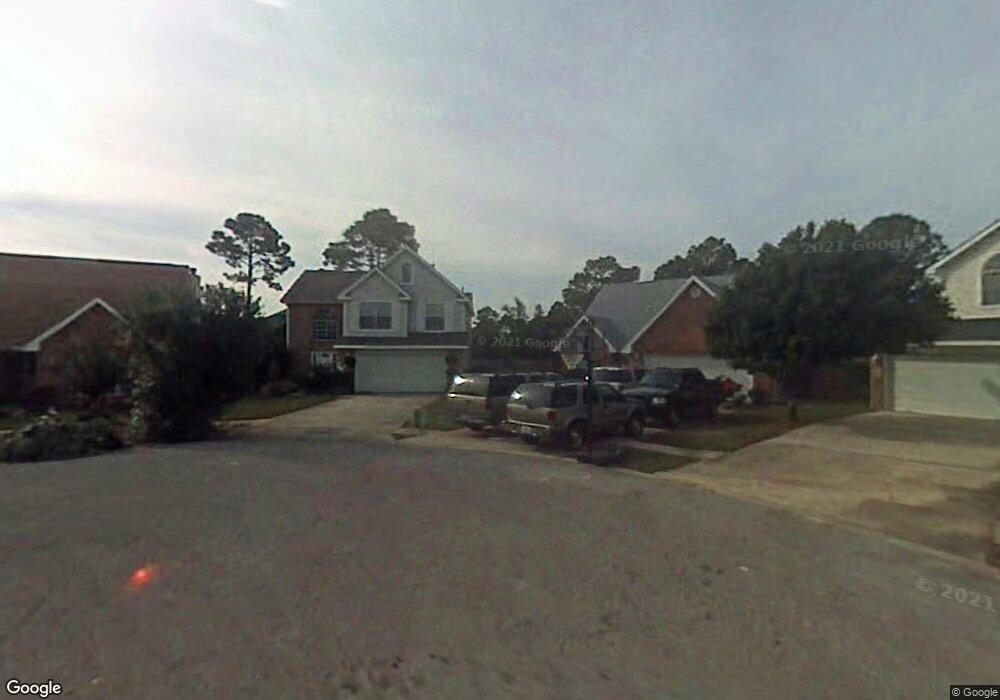
220 Misty Ct Destin, FL 32541
Estimated Value: $440,012 - $499,000
4
Beds
3
Baths
1,862
Sq Ft
$251/Sq Ft
Est. Value
About This Home
This home is located at 220 Misty Ct, Destin, FL 32541 and is currently estimated at $467,003, approximately $250 per square foot. 220 Misty Ct is a home located in Okaloosa County with nearby schools including Destin Elementary School, Destin Middle School, and Fort Walton Beach High School.
Ownership History
Date
Name
Owned For
Owner Type
Purchase Details
Closed on
Apr 16, 2009
Sold by
Moll Karen Lynn
Bought by
Molina Richard A
Current Estimated Value
Home Financials for this Owner
Home Financials are based on the most recent Mortgage that was taken out on this home.
Original Mortgage
$245,160
Outstanding Balance
$156,967
Interest Rate
5.18%
Mortgage Type
VA
Estimated Equity
$310,036
Purchase Details
Closed on
Jan 17, 2003
Sold by
Ogle Christopher J and Ogle Julie A
Bought by
Moll Karen Lynn
Home Financials for this Owner
Home Financials are based on the most recent Mortgage that was taken out on this home.
Original Mortgage
$140,000
Interest Rate
6.01%
Purchase Details
Closed on
Dec 8, 2000
Sold by
Keck Tracy L and Keck Bonnie
Bought by
Ogle Christopher J and Ogle Julie A
Home Financials for this Owner
Home Financials are based on the most recent Mortgage that was taken out on this home.
Original Mortgage
$139,500
Interest Rate
7.71%
Create a Home Valuation Report for This Property
The Home Valuation Report is an in-depth analysis detailing your home's value as well as a comparison with similar homes in the area
Home Values in the Area
Average Home Value in this Area
Purchase History
| Date | Buyer | Sale Price | Title Company |
|---|---|---|---|
| Molina Richard A | $240,000 | Old South Land Title | |
| Moll Karen Lynn | $176,000 | -- | |
| Ogle Christopher J | $155,000 | Touchstone Land Title Inc |
Source: Public Records
Mortgage History
| Date | Status | Borrower | Loan Amount |
|---|---|---|---|
| Open | Molina Richard A | $245,160 | |
| Previous Owner | Moll Karen Lynn | $140,000 | |
| Previous Owner | Ogle Christopher J | $139,500 |
Source: Public Records
Tax History Compared to Growth
Tax History
| Year | Tax Paid | Tax Assessment Tax Assessment Total Assessment is a certain percentage of the fair market value that is determined by local assessors to be the total taxable value of land and additions on the property. | Land | Improvement |
|---|---|---|---|---|
| 2024 | $4,224 | $393,451 | $126,199 | $267,252 |
| 2023 | $4,224 | $387,245 | $117,943 | $269,302 |
| 2022 | $3,792 | $336,849 | $83,618 | $253,231 |
| 2021 | $3,337 | $268,681 | $72,471 | $196,210 |
| 2020 | $3,101 | $247,872 | $69,020 | $178,852 |
| 2019 | $2,977 | $234,679 | $69,020 | $165,659 |
| 2018 | $2,794 | $217,621 | $0 | $0 |
| 2017 | $2,748 | $210,289 | $0 | $0 |
| 2016 | $2,697 | $207,619 | $0 | $0 |
| 2015 | $1,594 | $161,575 | $0 | $0 |
| 2014 | $1,598 | $160,293 | $0 | $0 |
Source: Public Records
Map
Nearby Homes
- 209 Misty Ct
- 3768 Misty Way
- 25 Court Dr
- 3761 Misty Way
- 16 Court Dr
- 12 Court Dr
- 995 Airport Rd Unit 28
- 995 Airport Rd Unit 37
- 807 & 809 Airport Rd
- 387 Twin Lakes Ln
- 73 Crest Place
- 154 Bayou Dr
- 317 Main St
- 421 Main St
- 423 Main St
- 319 Main St
- 400 Mattie M Kelly Blvd Unit 70
- 400 Mattie M Kelly Blvd Unit 7
- 308 Spring Ln
- 168 Bayou Dr