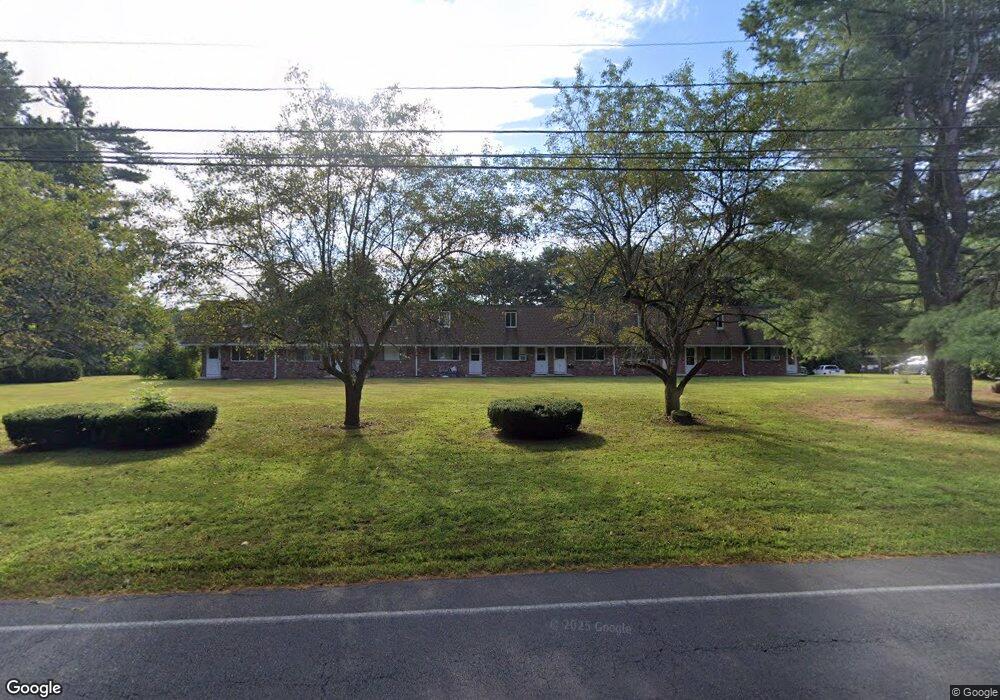
220 Monce Rd Unit 11 Burlington, CT 06013
Estimated Value: $173,000 - $211,479
2
Beds
2
Baths
992
Sq Ft
$194/Sq Ft
Est. Value
About This Home
This home is located at 220 Monce Rd Unit 11, Burlington, CT 06013 and is currently estimated at $192,120, approximately $193 per square foot. 220 Monce Rd Unit 11 is a home located in Hartford County with nearby schools including Lake Garda Elementary School, Har-Bur Middle School, and Lewis S. Mills High School.
Ownership History
Date
Name
Owned For
Owner Type
Purchase Details
Closed on
Sep 26, 2005
Sold by
Wanicki Scott I and Mathews Kathy L
Bought by
Rizzo Brian
Current Estimated Value
Home Financials for this Owner
Home Financials are based on the most recent Mortgage that was taken out on this home.
Original Mortgage
$130,000
Outstanding Balance
$70,282
Interest Rate
5.92%
Estimated Equity
$121,838
Purchase Details
Closed on
Mar 26, 2004
Sold by
Gulino James C
Bought by
Iwanicki Scott and Mathews Kathy L
Home Financials for this Owner
Home Financials are based on the most recent Mortgage that was taken out on this home.
Original Mortgage
$114,367
Interest Rate
5.65%
Purchase Details
Closed on
Mar 20, 2002
Sold by
Kendall Geraldine M and Kendall Hunter S
Bought by
Gulino James C
Create a Home Valuation Report for This Property
The Home Valuation Report is an in-depth analysis detailing your home's value as well as a comparison with similar homes in the area
Home Values in the Area
Average Home Value in this Area
Purchase History
| Date | Buyer | Sale Price | Title Company |
|---|---|---|---|
| Rizzo Brian | $146,000 | -- | |
| Rizzo Brian | $146,000 | -- | |
| Iwanicki Scott | $117,000 | -- | |
| Iwanicki Scott | $117,000 | -- | |
| Gulino James C | $80,000 | -- | |
| Gulino James C | $80,000 | -- |
Source: Public Records
Mortgage History
| Date | Status | Borrower | Loan Amount |
|---|---|---|---|
| Open | Gulino James C | $130,000 | |
| Closed | Gulino James C | $130,000 | |
| Previous Owner | Gulino James C | $114,367 |
Source: Public Records
Tax History
| Year | Tax Paid | Tax Assessment Tax Assessment Total Assessment is a certain percentage of the fair market value that is determined by local assessors to be the total taxable value of land and additions on the property. | Land | Improvement |
|---|---|---|---|---|
| 2025 | $2,359 | $88,690 | $0 | $88,690 |
| 2024 | $2,297 | $88,690 | $0 | $88,690 |
| 2023 | $2,376 | $73,780 | $0 | $73,780 |
| 2022 | $2,413 | $73,780 | $0 | $73,780 |
| 2021 | $2,464 | $73,780 | $0 | $73,780 |
| 2020 | $2,457 | $73,780 | $0 | $73,780 |
| 2019 | $2,435 | $73,780 | $0 | $73,780 |
| 2018 | $2,730 | $84,000 | $0 | $84,000 |
| 2017 | $2,688 | $84,000 | $0 | $84,000 |
| 2016 | $2,654 | $84,000 | $0 | $84,000 |
| 2015 | $2,612 | $84,000 | $0 | $84,000 |
| 2014 | $2,507 | $84,000 | $0 | $84,000 |
Source: Public Records
Map
Nearby Homes
- 12 Woodside St
- 16 Strong St
- 50 Woodhaven Dr
- 24 Green Woods Ln
- 19 Village View Ln
- 61 Litchfield Rd
- 84 Glen Eagle Dr
- 26 George Washington Turnpike
- 456 Plainville Ave
- 104 Driftwood Rd
- 8 Old Field Rd
- 419 Jerome Ave
- 10 Stone Ridge Crossing
- 60 Wildcat Rd
- 25 Sheffield Ln
- 1 Burlington Rd
- 52 Wood Creek Rd
- 1004 Jerome Ave
- 39 Jerome Ave
- 6 Pine Hill Rd
- 220 Monce Rd Unit 14
- 220 Monce Rd Unit 13
- 220 Monce Rd Unit 10
- 220 Monce Rd Unit 16
- 220 Monce Rd Unit 9
- 220 Monce Rd Unit 15
- 220 Monce Rd Unit 12
- 232 Monce Rd Unit 4
- 232 Monce Rd Unit 1
- 232 Monce Rd Unit 2
- 232 Monce Rd Unit 6
- 232 Monce Rd Unit 8
- 232 Monce Rd Unit 7
- 232 Monce Rd Unit 5
- 19 Venice Dr
- 11 Venice Dr
- 84 Stafford Rd
- 88 Stafford Rd
- 92 Stafford Rd
Your Personal Tour Guide
Ask me questions while you tour the home.