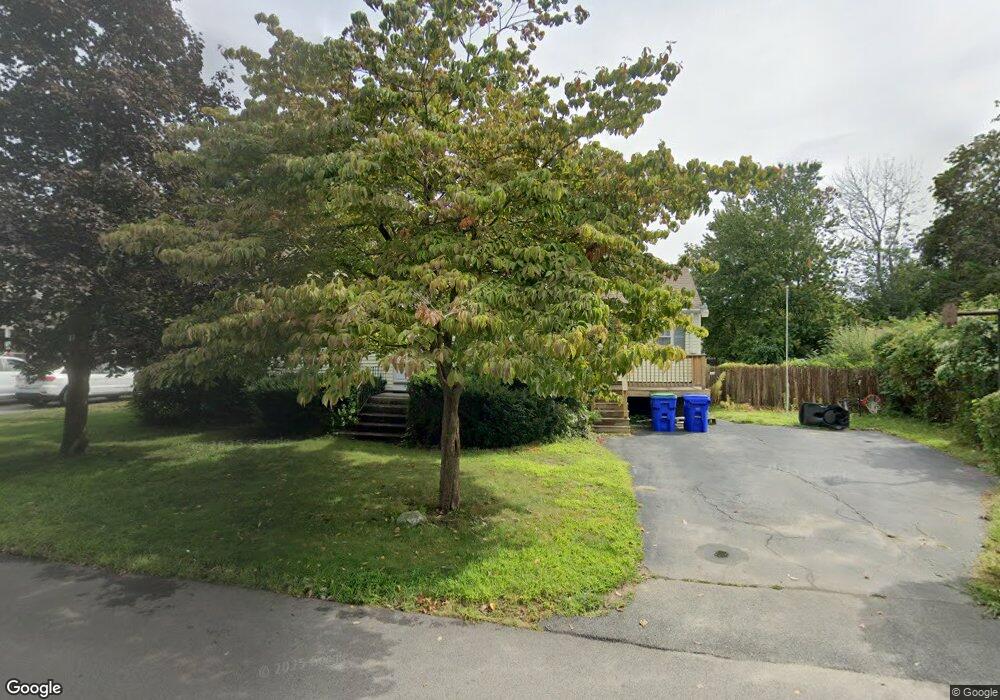
220 Moncrief Rd Rockland, MA 02370
Estimated Value: $547,000 - $651,000
4
Beds
2
Baths
1,568
Sq Ft
$382/Sq Ft
Est. Value
About This Home
This home is located at 220 Moncrief Rd, Rockland, MA 02370 and is currently estimated at $599,673, approximately $382 per square foot. 220 Moncrief Rd is a home located in Plymouth County with nearby schools including Rockland Senior High School, Calvary Chapel Academy, and Holy Family Elementary School.
Ownership History
Date
Name
Owned For
Owner Type
Purchase Details
Closed on
Mar 31, 2008
Sold by
Murphy Maurice Davis and Murphy Heather Wolf
Bought by
Wilson Robert W and Cook Debra L
Current Estimated Value
Home Financials for this Owner
Home Financials are based on the most recent Mortgage that was taken out on this home.
Original Mortgage
$279,000
Outstanding Balance
$171,603
Interest Rate
5.76%
Mortgage Type
Purchase Money Mortgage
Estimated Equity
$428,070
Purchase Details
Closed on
Jul 14, 2006
Sold by
Leblanc Joseph R and Leblanc Donna M
Bought by
Murphy Maurice Davis and Murphy Heather Wolf
Create a Home Valuation Report for This Property
The Home Valuation Report is an in-depth analysis detailing your home's value as well as a comparison with similar homes in the area
Home Values in the Area
Average Home Value in this Area
Purchase History
| Date | Buyer | Sale Price | Title Company |
|---|---|---|---|
| Wilson Robert W | $310,000 | -- | |
| Murphy Maurice Davis | $310,000 | -- |
Source: Public Records
Mortgage History
| Date | Status | Borrower | Loan Amount |
|---|---|---|---|
| Open | Murphy Maurice Davis | $279,000 |
Source: Public Records
Tax History
| Year | Tax Paid | Tax Assessment Tax Assessment Total Assessment is a certain percentage of the fair market value that is determined by local assessors to be the total taxable value of land and additions on the property. | Land | Improvement |
|---|---|---|---|---|
| 2025 | $6,667 | $487,700 | $224,400 | $263,300 |
| 2024 | $6,472 | $460,300 | $211,700 | $248,600 |
| 2023 | $6,429 | $422,400 | $194,200 | $228,200 |
| 2022 | $6,204 | $370,400 | $168,800 | $201,600 |
| 2021 | $5,830 | $337,400 | $153,500 | $183,900 |
| 2020 | $0 | $321,400 | $146,200 | $175,200 |
| 2019 | $5,492 | $306,500 | $139,300 | $167,200 |
| 2018 | $5,222 | $286,600 | $139,300 | $147,300 |
| 2017 | $5,052 | $273,400 | $139,300 | $134,100 |
| 2016 | $4,863 | $263,000 | $133,900 | $129,100 |
| 2015 | $4,649 | $244,300 | $125,200 | $119,100 |
| 2014 | $4,436 | $241,900 | $122,700 | $119,200 |
Source: Public Records
Map
Nearby Homes
- 107 Manzella Ct
- 696 Summer St
- 810 Brookline Way
- 8 Pat Rose Way
- 9 Old Market St
- 5 Pat Rose Way
- 9 Pat Rose Way
- 49 Liberty St
- 92 Liberty St
- 117 Liberty St
- 215 Market St
- 12 Linden St
- 50 Village Ln
- 50 Linden Park
- 225 W Water St
- 561 Circuit St
- 5 Alpine St
- 436 E Water St
- 63 Webster St
- 103 Grove St Unit 349
Your Personal Tour Guide
Ask me questions while you tour the home.