Estimated Value: $122,184 - $166,000
2
Beds
1
Bath
802
Sq Ft
$177/Sq Ft
Est. Value
About This Home
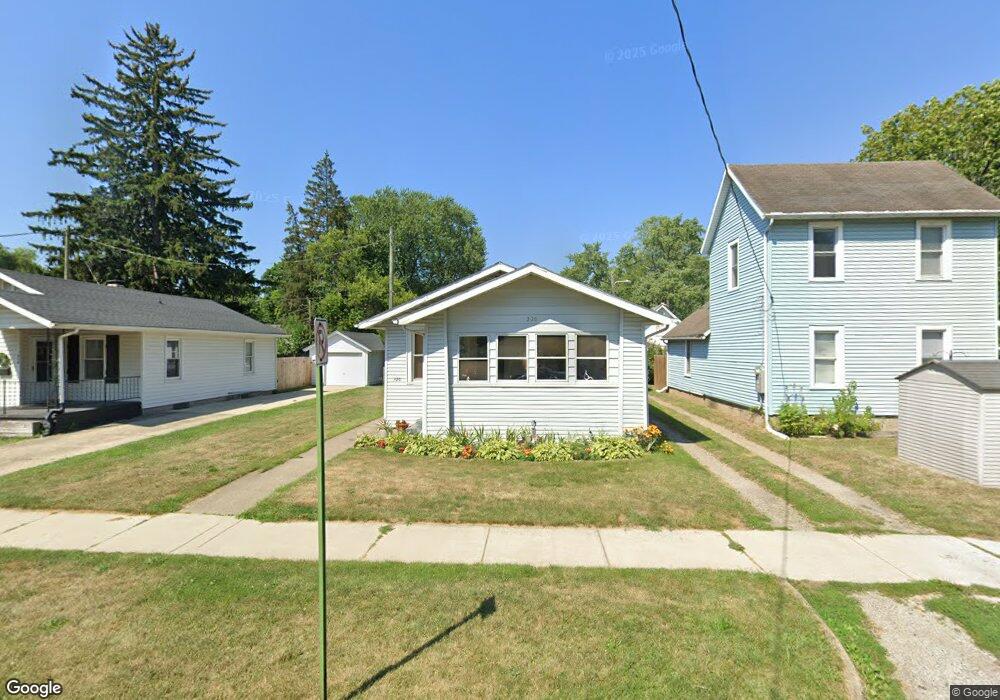
This home is located at 220 N 15th St, Niles, MI 49120 and is currently estimated at $142,046, approximately $177 per square foot. 220 N 15th St is a home located in Berrien County with nearby schools including Ballard Elementary School, Ring Lardner Middle School, and Oak Manor Sixth Grade Center.
Ownership History
Date
Name
Owned For
Owner Type
Purchase Details
Closed on
Dec 18, 2015
Sold by
Murdock Richard A and Murdock Jacqueline A
Bought by
Murdock Richard A and Murdock Jacqueline A
Current Estimated Value
Purchase Details
Closed on
Sep 3, 2014
Sold by
Hightower Matthew and Hightower Shanna
Bought by
Murdock Richard and Murdock Jacqueline
Purchase Details
Closed on
Jan 24, 2014
Sold by
Peters Roseva and Peters Kenneth
Bought by
Murdock Richard and Murdock Jacqueline
Purchase Details
Closed on
Mar 15, 2006
Sold by
Hightower Matthew and Hightower Shanna
Bought by
Peters Kenneth and Peters Roseva
Purchase Details
Closed on
Nov 30, 2004
Sold by
Life Enterprise Llc
Bought by
Hightower Matthew and Hightower Shanna
Purchase Details
Closed on
Aug 17, 2004
Sold by
Bartak Timothy R and Bartak Debora K
Bought by
Life Enterprise Llc
Purchase Details
Closed on
Aug 22, 2003
Sold by
Neldon Raymond E
Bought by
Bartak Timothy R and Bartak Debora K
Purchase Details
Closed on
Sep 29, 1994
Purchase Details
Closed on
Aug 25, 1983
Create a Home Valuation Report for This Property
The Home Valuation Report is an in-depth analysis detailing your home's value as well as a comparison with similar homes in the area
Home Values in the Area
Average Home Value in this Area
Purchase History
| Date | Buyer | Sale Price | Title Company |
|---|---|---|---|
| Murdock Richard A | -- | Attorney | |
| Murdock Richard | -- | None Available | |
| Murdock Richard | -- | None Available | |
| Peters Kenneth | -- | None Available | |
| Hightower Matthew | -- | -- | |
| Life Enterprise Llc | $58,000 | -- | |
| Bartak Timothy R | $32,000 | -- | |
| -- | $40,000 | -- | |
| -- | -- | -- |
Source: Public Records
Tax History
| Year | Tax Paid | Tax Assessment Tax Assessment Total Assessment is a certain percentage of the fair market value that is determined by local assessors to be the total taxable value of land and additions on the property. | Land | Improvement |
|---|---|---|---|---|
| 2025 | $1,252 | $48,500 | $0 | $0 |
| 2024 | $655 | $38,900 | $0 | $0 |
| 2023 | $628 | $28,500 | $0 | $0 |
| 2022 | $598 | $22,500 | $0 | $0 |
| 2021 | $1,094 | $20,800 | $2,300 | $18,500 |
| 2020 | $1,081 | $19,600 | $0 | $0 |
| 2019 | $1,066 | $18,500 | $1,600 | $16,900 |
| 2018 | $1,115 | $18,500 | $0 | $0 |
| 2017 | $2,384 | $22,500 | $0 | $0 |
| 2016 | $2,303 | $21,200 | $0 | $0 |
| 2015 | $2,296 | $20,800 | $0 | $0 |
| 2014 | $585 | $19,600 | $0 | $0 |
Source: Public Records
Map
Nearby Homes
- 1458 Sycamore St
- 1446 Sycamore St
- 1440 Sycamore St
- 302 N 15th St
- 1455 Sycamore St
- 1449 Regent St
- 1457 Regent St
- 1443 Regent St
- 1436 Sycamore St
- 1441 Regent St
- 308 N 15th St
- 1501 Sycamore St
- 221 N 15th St
- 217 N 15th St
- 1434 Sycamore St
- 1437 Regent St
- 205 N 15th St
- 1439 Sycamore St
- 201 N 15th St
- 309 N 15th St
Your Personal Tour Guide
Ask me questions while you tour the home.