Estimated Value: $474,000 - $551,000
5
Beds
3
Baths
2,793
Sq Ft
$181/Sq Ft
Est. Value
About This Home
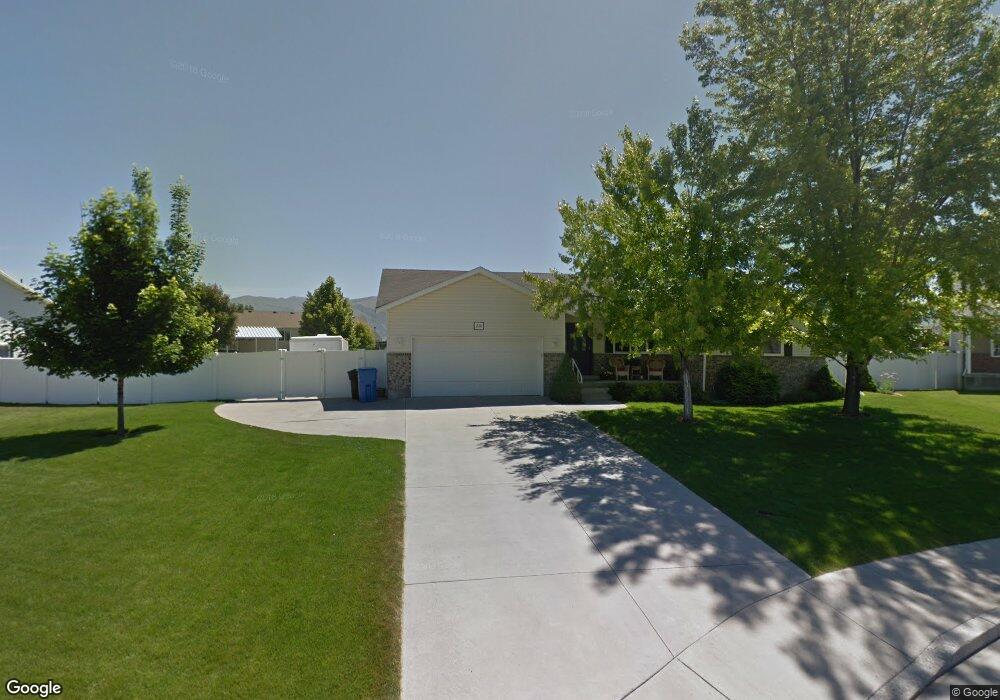
This home is located at 220 N 800 W, Hyrum, UT 84319 and is currently estimated at $506,115, approximately $181 per square foot. 220 N 800 W is a home located in Cache County with nearby schools including Lincoln School, South Cache Middle School, and Mountain Crest High School.
Ownership History
Date
Name
Owned For
Owner Type
Purchase Details
Closed on
Dec 8, 2022
Sold by
John W Alexander W and John Annette S
Bought by
Hamilton Kylie Dawn and Hamilton Diilan
Current Estimated Value
Home Financials for this Owner
Home Financials are based on the most recent Mortgage that was taken out on this home.
Original Mortgage
$352,800
Outstanding Balance
$342,118
Interest Rate
7.08%
Mortgage Type
New Conventional
Estimated Equity
$163,997
Purchase Details
Closed on
Aug 24, 2005
Sold by
Alexander John and Alexander Annette
Bought by
Alexander John W and Alexander Annette S
Create a Home Valuation Report for This Property
The Home Valuation Report is an in-depth analysis detailing your home's value as well as a comparison with similar homes in the area
Home Values in the Area
Average Home Value in this Area
Purchase History
| Date | Buyer | Sale Price | Title Company |
|---|---|---|---|
| Hamilton Kylie Dawn | -- | Pinnacle Title | |
| Alexander John W | -- | Cache Title Company | |
| Alexander John | -- | Cache Title Company |
Source: Public Records
Mortgage History
| Date | Status | Borrower | Loan Amount |
|---|---|---|---|
| Open | Hamilton Kylie Dawn | $352,800 |
Source: Public Records
Tax History Compared to Growth
Tax History
| Year | Tax Paid | Tax Assessment Tax Assessment Total Assessment is a certain percentage of the fair market value that is determined by local assessors to be the total taxable value of land and additions on the property. | Land | Improvement |
|---|---|---|---|---|
| 2025 | $1,785 | $256,275 | $0 | $0 |
| 2024 | $1,736 | $232,750 | $0 | $0 |
| 2023 | $1,796 | $230,295 | $0 | $0 |
| 2022 | $187 | $230,295 | $0 | $0 |
| 2021 | $1,838 | $347,975 | $65,000 | $282,975 |
| 2020 | $1,440 | $255,762 | $65,000 | $190,762 |
| 2019 | $1,381 | $230,762 | $40,000 | $190,762 |
| 2018 | $1,275 | $205,880 | $40,000 | $165,880 |
| 2017 | $1,252 | $104,940 | $0 | $0 |
| 2016 | $1,280 | $104,940 | $0 | $0 |
| 2015 | $1,119 | $91,495 | $0 | $0 |
| 2014 | $1,127 | $94,245 | $0 | $0 |
| 2013 | -- | $94,245 | $0 | $0 |
Source: Public Records
Map
Nearby Homes
- 220 N 800 W Unit 49
- 244 N 800 W
- 777 W 250 N Unit 28
- 200 N 800 W Unit 48
- 200 N 800 W
- 757 W 250 N Unit 29
- 757 W 250 N
- 215 N 750 W
- 215 N 750 W Unit 31
- 235 N 750 W Unit 30
- 235 N 750 W
- 185 N 800 W Unit 47
- 185 N 800 W
- 195 N 750 W
- 195 N 750 W Unit 32
- 815 W 250 N
- 830 250 N Unit 27
- 823 250 N Unit 1
- 225 N 800 W
- 770 W 150 N Unit 34