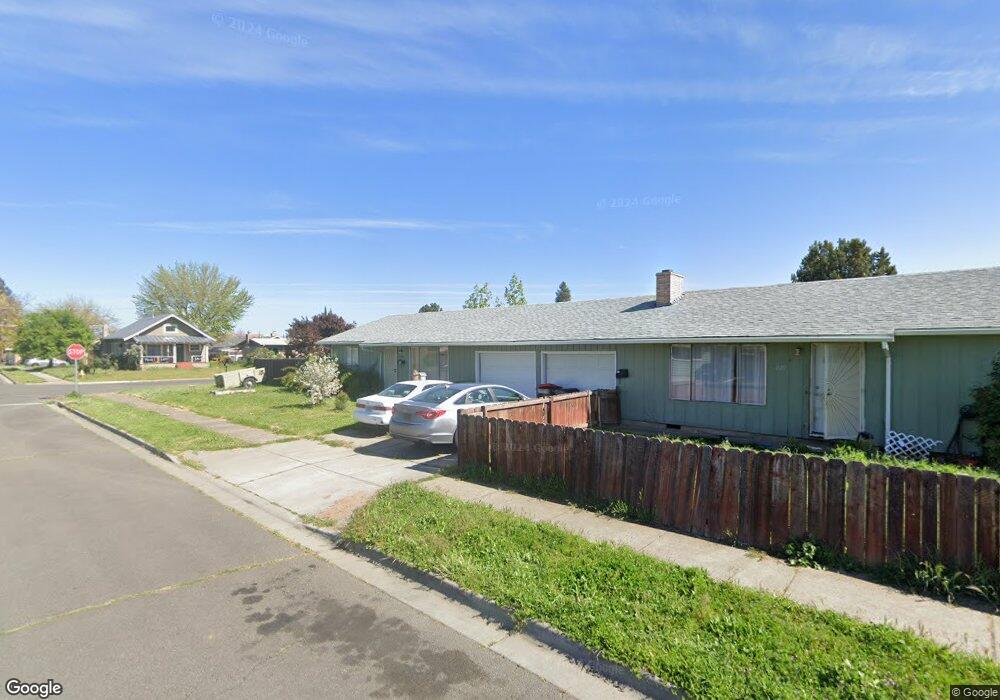
220 N 9th St Central Point, OR 97502
Estimated Value: $357,366 - $485,000
4
Beds
2
Baths
1,716
Sq Ft
$252/Sq Ft
Est. Value
About This Home
This home is located at 220 N 9th St, Central Point, OR 97502 and is currently estimated at $431,592, approximately $251 per square foot. 220 N 9th St is a home located in Jackson County with nearby schools including Jewett Elementary School, Scenic Middle School, and Crater High School.
Ownership History
Date
Name
Owned For
Owner Type
Purchase Details
Closed on
Jul 14, 2020
Sold by
Knight Rick David and Knight Questa
Bought by
Knight Rick David and Knight Questa
Current Estimated Value
Purchase Details
Closed on
Jan 22, 2018
Sold by
Knight Shirley L and Knight Rick David
Bought by
Robert W Knight And Shirley L Knight Revocabl and Knight
Purchase Details
Closed on
Jul 30, 2014
Sold by
Knight Robert W and Knight Shirley L
Bought by
The Robert W Knight & Shirley Knight Rev
Create a Home Valuation Report for This Property
The Home Valuation Report is an in-depth analysis detailing your home's value as well as a comparison with similar homes in the area
Home Values in the Area
Average Home Value in this Area
Purchase History
| Date | Buyer | Sale Price | Title Company |
|---|---|---|---|
| Knight Rick David | -- | None Available | |
| Robert W Knight And Shirley L Knight Revocabl | -- | None Listed On Document | |
| The Robert W Knight & Shirley Knight Rev | -- | None Available |
Source: Public Records
Tax History Compared to Growth
Tax History
| Year | Tax Paid | Tax Assessment Tax Assessment Total Assessment is a certain percentage of the fair market value that is determined by local assessors to be the total taxable value of land and additions on the property. | Land | Improvement |
|---|---|---|---|---|
| 2025 | $3,251 | $195,530 | $94,930 | $100,600 |
| 2024 | $3,251 | $189,840 | $92,170 | $97,670 |
| 2023 | $3,146 | $184,320 | $89,490 | $94,830 |
| 2022 | $3,073 | $184,320 | $89,490 | $94,830 |
| 2021 | $2,985 | $178,960 | $86,880 | $92,080 |
| 2020 | $2,898 | $173,750 | $84,350 | $89,400 |
| 2019 | $2,827 | $163,780 | $79,510 | $84,270 |
| 2018 | $2,741 | $159,010 | $77,200 | $81,810 |
| 2017 | $2,672 | $159,010 | $77,200 | $81,810 |
| 2016 | $2,594 | $149,890 | $72,780 | $77,110 |
| 2015 | $2,485 | $149,890 | $72,780 | $77,110 |
| 2014 | $2,422 | $141,300 | $68,600 | $72,700 |
Source: Public Records
Map
Nearby Homes