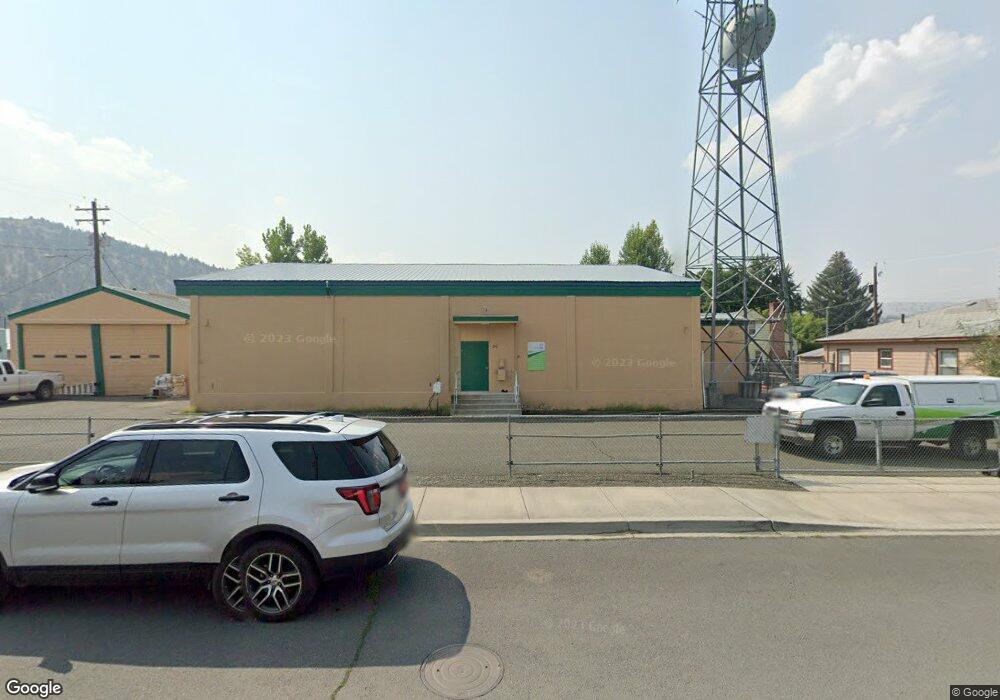
220 N Canyon City Blvd Canyon City, OR 97820
Estimated Value: $171,133
1
Bed
5
Baths
1,934
Sq Ft
$88/Sq Ft
Est. Value
About This Home
This home is located at 220 N Canyon City Blvd, Canyon City, OR 97820 and is currently estimated at $171,133, approximately $88 per square foot. 220 N Canyon City Blvd is a home located in Grant County with nearby schools including Grant Union Junior/Senior High School.
Ownership History
Date
Name
Owned For
Owner Type
Purchase Details
Closed on
Jul 15, 2024
Sold by
Canyon Creek Business Center Llc
Bought by
Moles Michael R and Moles Heather N
Current Estimated Value
Home Financials for this Owner
Home Financials are based on the most recent Mortgage that was taken out on this home.
Original Mortgage
$160,000
Outstanding Balance
$146,576
Interest Rate
7.03%
Mortgage Type
New Conventional
Estimated Equity
$24,557
Purchase Details
Closed on
Sep 19, 2012
Sold by
Warren Robert K and Warren Joni F
Bought by
Canyon Creek Business Center Llc
Create a Home Valuation Report for This Property
The Home Valuation Report is an in-depth analysis detailing your home's value as well as a comparison with similar homes in the area
Home Values in the Area
Average Home Value in this Area
Purchase History
| Date | Buyer | Sale Price | Title Company |
|---|---|---|---|
| Moles Michael R | $200,000 | None Listed On Document | |
| Canyon Creek Business Center Llc | $65,000 | Land Title Company Of Grant |
Source: Public Records
Mortgage History
| Date | Status | Borrower | Loan Amount |
|---|---|---|---|
| Open | Moles Michael R | $160,000 |
Source: Public Records
Tax History Compared to Growth
Tax History
| Year | Tax Paid | Tax Assessment Tax Assessment Total Assessment is a certain percentage of the fair market value that is determined by local assessors to be the total taxable value of land and additions on the property. | Land | Improvement |
|---|---|---|---|---|
| 2024 | $1,326 | $84,332 | $40,702 | $43,630 |
| 2023 | $1,288 | $81,876 | $39,515 | $42,361 |
| 2022 | $1,245 | $79,492 | $38,369 | $41,123 |
| 2021 | $1,201 | $77,177 | $37,248 | $39,929 |
| 2020 | $1,262 | $74,930 | $36,164 | $38,766 |
| 2019 | $1,230 | $72,748 | $40,428 | $32,320 |
| 2018 | $1,058 | $63,790 | $35,450 | $28,340 |
| 2017 | $1,101 | $63,790 | $35,450 | $28,340 |
| 2016 | $1,106 | $63,790 | $35,450 | $28,340 |
| 2015 | $1,222 | $67,810 | $37,680 | $30,130 |
| 2014 | $1,222 | $67,810 | $37,680 | $30,130 |
| 2013 | $1,240 | $70,630 | $39,250 | $31,380 |
Source: Public Records
Map
Nearby Homes
- 4035 Patterson Dr
- 4008 Patterson Dr
- 0 Elkview Dr Unit 22158071
- 0 Elkview Dr Unit 24255395
- 0 Elkview Dr Unit 195119069
- 0 Elkview Dr Unit 362870233
- 0 Elkview Dr Unit 24441871
- 1500 Elk View Dr
- 2709 Elk View Dr
- 217 Elkview Dr
- 2700 Elkview Dr
- 216 Elkview Dr
- 265 Elk View Dr
- 60625 Three Point Rd
- 338 Inland Dr
- 206 S Washington St
- 107 Rebel Hill Rd
- 60408 Marysville Ln
- 204 Adam Dr
- 324 Edgewood Dr
- 220 N Humbolt St
- 218 N Humbolt St
- 216 N Humbolt St
- 222 N Humbolt St
- 214 N Humbolt St
- 224 N Humbolt St
- 219 N Humbolt St
- 217 N Humbolt St
- 210 N Humbolt St
- 215 N Humbolt St
- 226 N Humbolt St
- 223 N Humbolt St
- 208 N Humbolt St
- 211 N Humbolt St
- 228 N Humbolt St
- 227 N Humbolt St
- 206 N Humbolt St
- 0 N Humbolt St Unit 7400
- 230 N Humbolt St
- 204 N Humbolt St