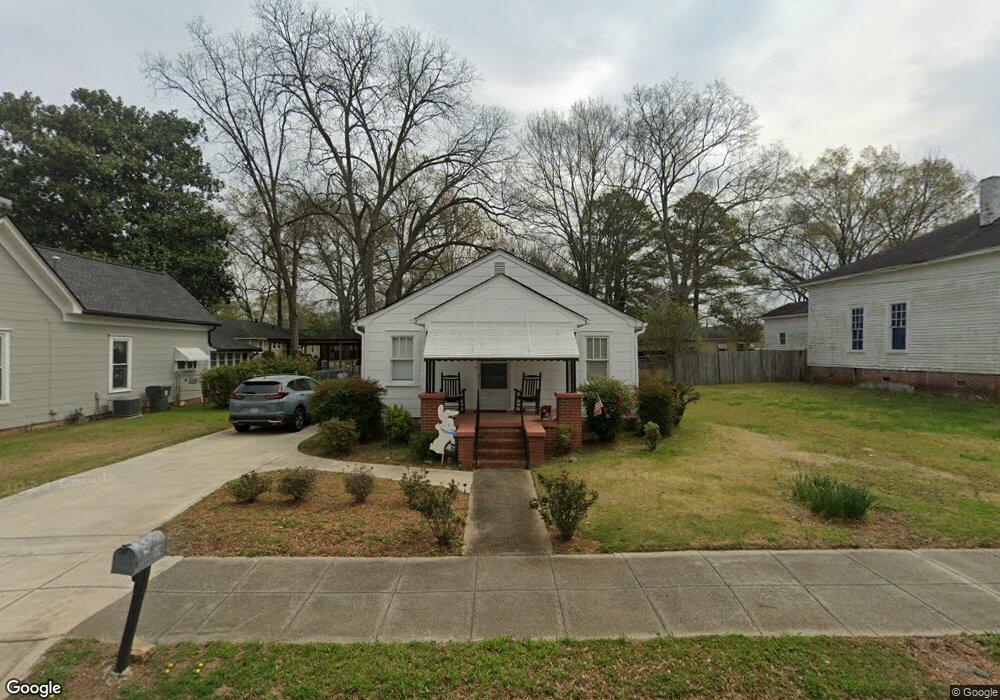
220 N Cave Spring St Cedartown, GA 30125
Estimated Value: $165,824 - $200,000
2
Beds
2
Baths
1,080
Sq Ft
$163/Sq Ft
Est. Value
About This Home
This home is located at 220 N Cave Spring St, Cedartown, GA 30125 and is currently estimated at $175,706, approximately $162 per square foot. 220 N Cave Spring St is a home located in Polk County with nearby schools including Cedar Christian School and Vineyard Harvester Christian Academy.
Ownership History
Date
Name
Owned For
Owner Type
Purchase Details
Closed on
Dec 22, 2021
Sold by
Lankford Robert Garland
Bought by
Lankford Judith R
Current Estimated Value
Home Financials for this Owner
Home Financials are based on the most recent Mortgage that was taken out on this home.
Original Mortgage
$120,000
Outstanding Balance
$110,383
Interest Rate
3.12%
Mortgage Type
New Conventional
Estimated Equity
$65,323
Purchase Details
Closed on
Jan 16, 2018
Sold by
Amy D Walters
Bought by
Lankford Robert
Home Financials for this Owner
Home Financials are based on the most recent Mortgage that was taken out on this home.
Original Mortgage
$60,000
Interest Rate
3.99%
Purchase Details
Closed on
Nov 13, 2017
Sold by
Walters Amy D
Bought by
Lankford Robert Garland
Purchase Details
Closed on
Mar 27, 2015
Sold by
Dutton Cherry
Bought by
Tillery Amy
Home Financials for this Owner
Home Financials are based on the most recent Mortgage that was taken out on this home.
Original Mortgage
$68,590
Interest Rate
3.89%
Mortgage Type
New Conventional
Purchase Details
Closed on
Jun 18, 2014
Sold by
Dutton Cherry W *
Bought by
Dutton Cherry
Purchase Details
Closed on
Nov 13, 2003
Sold by
Tillery Ronald Craig
Bought by
Dutton Cherry
Purchase Details
Closed on
Apr 8, 2002
Sold by
Tillery Amy D
Bought by
Tillery Ronald Craig
Purchase Details
Closed on
Dec 21, 2001
Sold by
Tillery Carol
Bought by
Tillery Ronald Craig and Tiller Amy D
Purchase Details
Closed on
Nov 28, 1994
Sold by
Tillery Ronald
Bought by
Tillery Carol
Purchase Details
Closed on
Oct 4, 1994
Sold by
Tillery Ronald
Bought by
Tillery Carol
Purchase Details
Closed on
Apr 15, 1993
Sold by
Davis Buford P
Bought by
Tillery Ronald
Purchase Details
Closed on
Jan 25, 1993
Sold by
Davis Buford P Exec
Bought by
Davis Buford P
Purchase Details
Closed on
Dec 29, 1992
Sold by
Watson Glenna Chandler
Bought by
Davis Buford P As Executor For Glen
Purchase Details
Closed on
Jul 10, 1973
Sold by
Watson Marvin E Mr
Bought by
Watson Glenna C
Purchase Details
Closed on
Nov 17, 1947
Bought by
Watson Marvin E Mr
Create a Home Valuation Report for This Property
The Home Valuation Report is an in-depth analysis detailing your home's value as well as a comparison with similar homes in the area
Home Values in the Area
Average Home Value in this Area
Purchase History
| Date | Buyer | Sale Price | Title Company |
|---|---|---|---|
| Lankford Judith R | $140,000 | -- | |
| Lankford Robert | $73,500 | -- | |
| Lankford Robert Garland | $73,500 | -- | |
| Tillery Amy | $72,200 | -- | |
| Dutton Cherry | -- | -- | |
| Dutton Cherry | $59,000 | -- | |
| Tillery Ronald Craig | -- | -- | |
| Tillery Ronald Craig | -- | -- | |
| Tillery Carol | -- | -- | |
| Tillery Carol | -- | -- | |
| Tillery Ronald | $21,300 | -- | |
| Davis Buford P | -- | -- | |
| Davis Buford P As Executor For Glen | -- | -- | |
| Watson Glenna C | -- | -- | |
| Watson Marvin E Mr | -- | -- |
Source: Public Records
Mortgage History
| Date | Status | Borrower | Loan Amount |
|---|---|---|---|
| Open | Lankford Judith R | $120,000 | |
| Previous Owner | Lankford Robert | $60,000 | |
| Previous Owner | Lankford Robert | -- | |
| Previous Owner | Tillery Amy | $68,590 |
Source: Public Records
Tax History Compared to Growth
Tax History
| Year | Tax Paid | Tax Assessment Tax Assessment Total Assessment is a certain percentage of the fair market value that is determined by local assessors to be the total taxable value of land and additions on the property. | Land | Improvement |
|---|---|---|---|---|
| 2024 | $1,292 | $51,316 | $2,520 | $48,796 |
| 2023 | $789 | $32,566 | $2,520 | $30,046 |
| 2022 | $363 | $28,678 | $2,520 | $26,158 |
| 2021 | $368 | $28,678 | $2,520 | $26,158 |
| 2020 | $282 | $25,101 | $2,520 | $22,581 |
| 2019 | $168 | $18,974 | $2,880 | $16,094 |
| 2018 | $510 | $18,508 | $2,880 | $15,628 |
| 2017 | $449 | $18,508 | $2,880 | $15,628 |
| 2016 | $449 | $18,508 | $2,880 | $15,628 |
| 2015 | $458 | $16,795 | $2,880 | $13,915 |
| 2014 | $462 | $16,795 | $2,880 | $13,915 |
| 2013 | -- | $15,598 | $1,680 | $13,918 |
Source: Public Records
Map
Nearby Homes
- 305 N Cave Spring St
- 214 Victoria Ave
- 258 Chestnut St
- 421 Wissahickon Ave
- 309 Walnut St
- 408 N College St
- 144 Marshall St
- 605 W Girard Ave
- 228 Marshall St
- 328 Mountain Home Rd
- 601 Mountain Home Rd
- 422 Walnut St
- 443 N Cave Spring St
- 607 N College St
- 214 Jule Peek Ave
- 208 Highland Ave
- 328 330 Stubbs
- 217 E Gibson St
- 403 Lakeside Dr
- 254 E Girard Ave
- 206 N Cave Spring St
- 217 N Cave Spring St
- 224 N Cave Spring St
- 228 N Cave Spring St
- 156 N Cave Spring St
- 312 W Queen St
- 219 N Cave Spring St
- 232 N Cave Spring St
- 307 Victoria Ave
- 201 N Cave Spring St
- 152 N Cave Spring St
- 305 Victoria Ave
- 404 Vine St
- 305 W Queen St
- 302 W Queen St
- 409 Victoria Ave
- 408 Vine St
- 318 Victoria Ave
- 148 N Cave Spring St
- 301 W Queen St