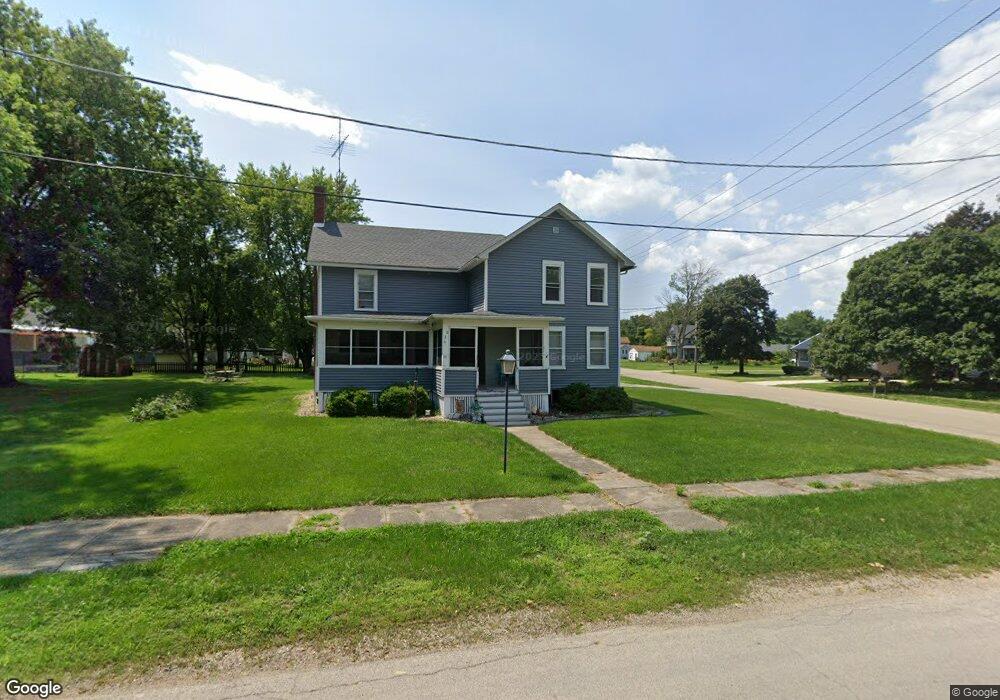
220 N East St Earlville, IL 60518
Estimated Value: $167,000 - $251,000
3
Beds
2
Baths
1,592
Sq Ft
$134/Sq Ft
Est. Value
About This Home
This home is located at 220 N East St, Earlville, IL 60518 and is currently estimated at $213,070, approximately $133 per square foot. 220 N East St is a home located in LaSalle County with nearby schools including Earlville Elementary School and Earlville Junior/Senior High School.
Ownership History
Date
Name
Owned For
Owner Type
Purchase Details
Closed on
Jan 25, 2010
Sold by
Baker Mervin Roy
Bought by
Rhoton Timothy M
Current Estimated Value
Home Financials for this Owner
Home Financials are based on the most recent Mortgage that was taken out on this home.
Original Mortgage
$111,650
Outstanding Balance
$73,300
Interest Rate
4.87%
Mortgage Type
New Conventional
Estimated Equity
$139,770
Purchase Details
Closed on
Feb 18, 2009
Sold by
Sesretary Of Hud
Bought by
Baker Mervin Roy
Create a Home Valuation Report for This Property
The Home Valuation Report is an in-depth analysis detailing your home's value as well as a comparison with similar homes in the area
Home Values in the Area
Average Home Value in this Area
Purchase History
| Date | Buyer | Sale Price | Title Company |
|---|---|---|---|
| Rhoton Timothy M | $109,500 | None Available | |
| Baker Mervin Roy | $54,500 | None Available |
Source: Public Records
Mortgage History
| Date | Status | Borrower | Loan Amount |
|---|---|---|---|
| Open | Rhoton Timothy M | $111,650 |
Source: Public Records
Tax History Compared to Growth
Tax History
| Year | Tax Paid | Tax Assessment Tax Assessment Total Assessment is a certain percentage of the fair market value that is determined by local assessors to be the total taxable value of land and additions on the property. | Land | Improvement |
|---|---|---|---|---|
| 2024 | $4,253 | $50,741 | $4,017 | $46,724 |
| 2023 | $3,896 | $44,820 | $3,548 | $41,272 |
| 2022 | $3,434 | $37,804 | $6,914 | $30,890 |
| 2021 | $3,507 | $37,158 | $6,796 | $30,362 |
| 2020 | $3,403 | $36,044 | $6,592 | $29,452 |
| 2019 | $3,337 | $34,485 | $6,307 | $28,178 |
| 2018 | $2,617 | $26,508 | $6,153 | $20,355 |
| 2017 | $2,451 | $24,193 | $5,616 | $18,577 |
| 2016 | $2,348 | $22,611 | $5,249 | $17,362 |
| 2015 | $1,641 | $21,664 | $5,029 | $16,635 |
| 2012 | -- | $25,455 | $5,909 | $19,546 |
Source: Public Records
Map
Nearby Homes