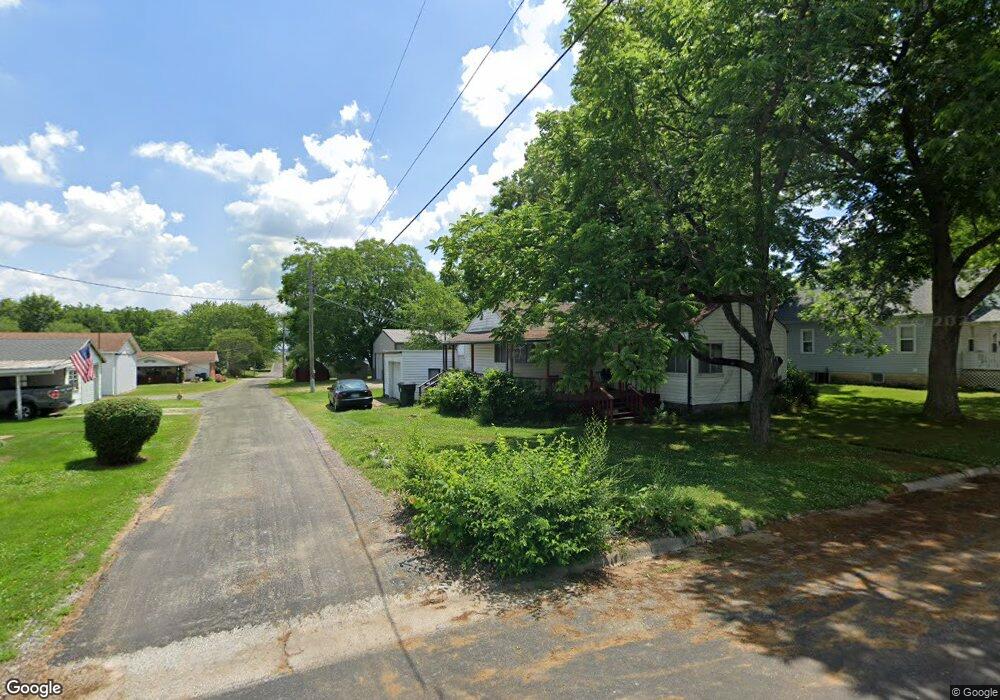
220 N Fillmore St Red Bud, IL 62278
Estimated Value: $76,505 - $120,000
--
Bed
--
Bath
--
Sq Ft
6,534
Sq Ft Lot
About This Home
This home is located at 220 N Fillmore St, Red Bud, IL 62278 and is currently estimated at $100,376. 220 N Fillmore St is a home located in Randolph County with nearby schools including Red Bud Elementary School and Red Bud High School.
Ownership History
Date
Name
Owned For
Owner Type
Purchase Details
Closed on
Aug 16, 2024
Sold by
Watters Jeffrey M and Watters Marcia L
Bought by
Chandler Bradley S and Chandler Brenda M
Current Estimated Value
Purchase Details
Closed on
Jul 27, 2024
Sold by
Niemeyer Kimberly K and Walker Noel
Bought by
Watters Jeffrey M and Watters Marcia L
Purchase Details
Closed on
May 14, 2008
Sold by
Watters Claud J and Watters Ann B
Bought by
Walker Noel and Niemeyer Kimberly
Purchase Details
Closed on
Aug 23, 2005
Sold by
Kempfer Byron K and Kempfer Eunice M
Bought by
Watters Claud J and Watters An B
Home Financials for this Owner
Home Financials are based on the most recent Mortgage that was taken out on this home.
Original Mortgage
$46,500
Interest Rate
7%
Mortgage Type
Unknown
Create a Home Valuation Report for This Property
The Home Valuation Report is an in-depth analysis detailing your home's value as well as a comparison with similar homes in the area
Home Values in the Area
Average Home Value in this Area
Purchase History
| Date | Buyer | Sale Price | Title Company |
|---|---|---|---|
| Chandler Bradley S | $50,000 | None Listed On Document | |
| Watters Jeffrey M | -- | None Listed On Document | |
| Walker Noel | $5,000 | None Available | |
| Watters Claud J | $46,500 | None Available |
Source: Public Records
Mortgage History
| Date | Status | Borrower | Loan Amount |
|---|---|---|---|
| Previous Owner | Watters Claud J | $46,500 |
Source: Public Records
Tax History Compared to Growth
Tax History
| Year | Tax Paid | Tax Assessment Tax Assessment Total Assessment is a certain percentage of the fair market value that is determined by local assessors to be the total taxable value of land and additions on the property. | Land | Improvement |
|---|---|---|---|---|
| 2024 | $1,062 | $23,770 | $5,785 | $17,985 |
| 2023 | $972 | $22,255 | $5,415 | $16,840 |
| 2022 | $882 | $20,750 | $5,050 | $15,700 |
| 2021 | $829 | $19,865 | $4,835 | $15,030 |
| 2020 | $851 | $20,349 | $4,950 | $15,399 |
| 2019 | $910 | $19,380 | $7,360 | $12,020 |
| 2018 | $897 | $21,366 | $8,114 | $13,252 |
| 2017 | $787 | $18,550 | $7,045 | $11,505 |
| 2016 | $726 | $17,985 | $6,830 | $11,155 |
| 2015 | $919 | $20,785 | $6,730 | $14,055 |
| 2014 | $919 | $21,250 | $6,880 | $14,370 |
| 2013 | $960 | $22,185 | $6,880 | $15,305 |
Source: Public Records
Map
Nearby Homes
- 115 S Taylor St
- 1113 E Market St
- 508 E South 1st St Unit ES
- 304 E South 1st St
- 323 N Main St
- 221 N Main St
- 303 E South 3rd St Unit ES
- 308 S Main St
- 254 Charles St
- 220 Willow Run Dr
- 304 Country Club Dr
- 985 Powell Rd
- 3554 Russell Dr
- 9668 S Prairie Rd
- 0 White Swan Park Unit 32 17096895
- 000 Mm Rd
- 0 Mm Rd
- 111 W Mill St
- 201 Kaskaskia St
- 1916 Ames Rd
- 212 N Fillmore St
- 815 High St
- 304 N Fillmore St
- 217 N Fillmore St
- 310 N Fillmore St
- 305 N Fillmore St
- 303 N Taylor St
- 818 Green St
- 219 N Taylor St
- 803 E Olive St
- 215 N Taylor St
- 811 E Olive St
- 309 N Fillmore St
- 817 E Olive St
- 715 E Olive St
- 719 E Pine St
- 212 Van Buren St
- 307 N Taylor St
- 209 N Taylor St
- 304 Van Buren St