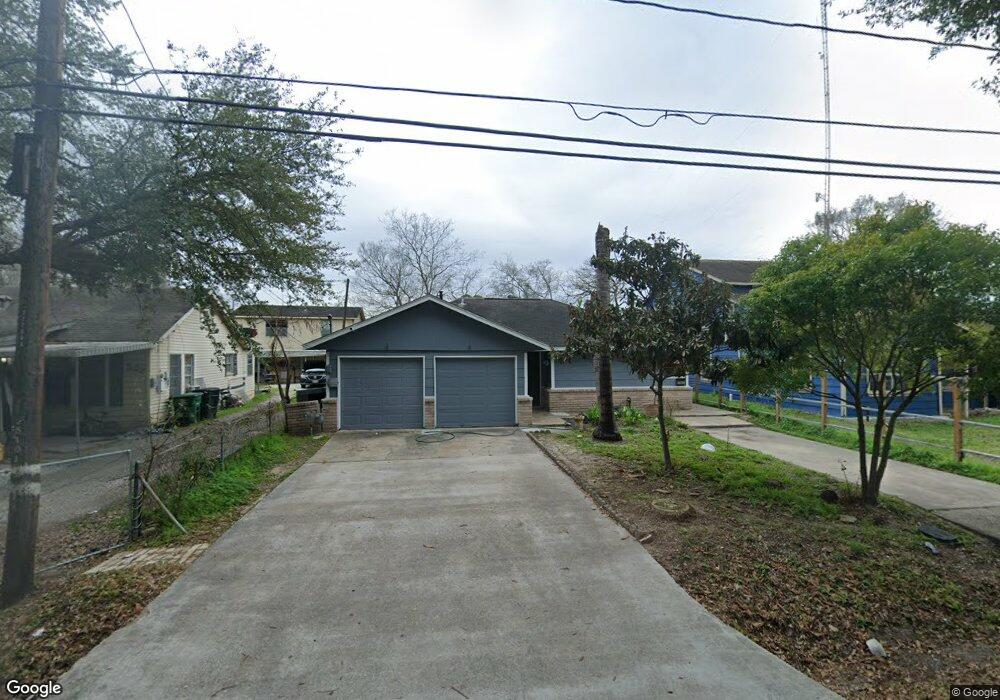
220 Neyland St Houston, TX 77022
Northside-Northline NeighborhoodEstimated Value: $243,000 - $319,000
3
Beds
2
Baths
1,434
Sq Ft
$196/Sq Ft
Est. Value
About This Home
This home is located at 220 Neyland St, Houston, TX 77022 and is currently estimated at $280,788, approximately $195 per square foot. 220 Neyland St is a home located in Harris County with nearby schools including Herrera Elementary School, Burbank Middle School, and Sam Houston Math, Science & Technology Center.
Ownership History
Date
Name
Owned For
Owner Type
Purchase Details
Closed on
Jul 29, 2022
Sold by
Gonzales and Hermila
Bought by
Dominguez Ruben Ernesto and Loya Maria Elena
Current Estimated Value
Home Financials for this Owner
Home Financials are based on the most recent Mortgage that was taken out on this home.
Original Mortgage
$233,516
Outstanding Balance
$223,723
Interest Rate
5.78%
Mortgage Type
FHA
Estimated Equity
$57,065
Purchase Details
Closed on
Aug 25, 2008
Sold by
Gonzales Hermila
Bought by
Gonzales Richard and Gonzales Hermila
Purchase Details
Closed on
Mar 11, 2003
Sold by
Devco Land Development Ltd
Bought by
Newmark Homes Lp
Create a Home Valuation Report for This Property
The Home Valuation Report is an in-depth analysis detailing your home's value as well as a comparison with similar homes in the area
Home Values in the Area
Average Home Value in this Area
Purchase History
| Date | Buyer | Sale Price | Title Company |
|---|---|---|---|
| Dominguez Ruben Ernesto | -- | None Listed On Document | |
| Gonzales Richard | -- | None Available | |
| Newmark Homes Lp | -- | Universal Land Title |
Source: Public Records
Mortgage History
| Date | Status | Borrower | Loan Amount |
|---|---|---|---|
| Open | Dominguez Ruben Ernesto | $233,516 |
Source: Public Records
Tax History Compared to Growth
Tax History
| Year | Tax Paid | Tax Assessment Tax Assessment Total Assessment is a certain percentage of the fair market value that is determined by local assessors to be the total taxable value of land and additions on the property. | Land | Improvement |
|---|---|---|---|---|
| 2025 | $2,104 | $261,551 | $98,175 | $163,376 |
| 2024 | $2,104 | $230,896 | $98,175 | $132,721 |
| 2023 | $2,104 | $244,886 | $85,181 | $159,705 |
| 2022 | $4,421 | $213,141 | $63,525 | $149,616 |
| 2021 | $4,255 | $182,994 | $63,525 | $119,469 |
| 2020 | $4,019 | $167,959 | $63,525 | $104,434 |
| 2019 | $3,818 | $158,061 | $51,975 | $106,086 |
| 2018 | $560 | $137,151 | $36,094 | $101,057 |
| 2017 | $3,468 | $137,151 | $36,094 | $101,057 |
| 2016 | $3,174 | $137,151 | $36,094 | $101,057 |
| 2015 | $657 | $131,674 | $28,875 | $102,799 |
| 2014 | $657 | $108,901 | $20,213 | $88,688 |
Source: Public Records
Map
Nearby Homes
- 7111 Bauman Rd
- 249 Basswood St
- 7311 Roswell St
- 7317 Roswell St
- 210 Van Molan St
- 7014 Finn St
- 164 Wallace St
- 7315 Roswell St
- 121-123 Van Molan St
- 7018 Finn St
- 7015 Roswell St
- 105 Oddo St
- 245 Palmyra St
- 65 Neyland St
- 428 Van Molan St
- 7009 Amber St
- 7523 Roswell St
- 212B Garrotsville St
- 212A Garrotsville St
- 136 Theron St
- 218 Neyland St
- 222 Neyland St
- 224 Neyland St
- 224 Neyland St
- 214 Neyland St
- 219 Neyland St
- 226 Neyland St
- 217 Neyland St
- 221 Neyland St
- 223 Neyland St
- 206 Neyland St
- 228 Neyland St
- 211 Neyland St
- 230 Neyland St
- 204 Neyland St
- 227 Neyland St
- 207 Neyland St
- 120 Neyland St
- 232 Neyland St
- 220 Weisenberger Dr