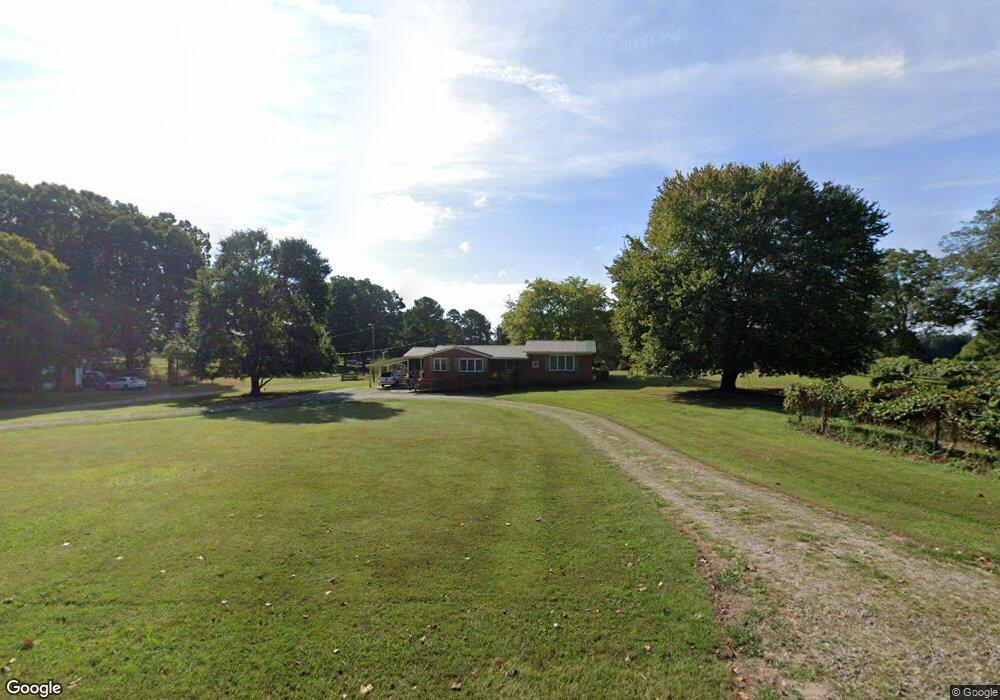
220 Pete Smith Rd Louisburg, NC 27549
Estimated Value: $155,000 - $235,311
2
Beds
2
Baths
1,451
Sq Ft
$136/Sq Ft
Est. Value
About This Home
This home is located at 220 Pete Smith Rd, Louisburg, NC 27549 and is currently estimated at $197,578, approximately $136 per square foot. 220 Pete Smith Rd is a home located in Franklin County with nearby schools including Laurel Mill Elementary School, Terrell Lane Middle School, and Louisburg High School.
Ownership History
Date
Name
Owned For
Owner Type
Purchase Details
Closed on
Apr 16, 2013
Sold by
Foster Annette G
Bought by
Foster John R
Current Estimated Value
Purchase Details
Closed on
Mar 15, 2013
Sold by
Collins Lynda Foster and Foster John M
Bought by
Foster John R
Purchase Details
Closed on
Jun 25, 2012
Sold by
Collins Lynda Foster and Collins Blaine Keith
Bought by
Collins Lynda Foster and Foster John M
Create a Home Valuation Report for This Property
The Home Valuation Report is an in-depth analysis detailing your home's value as well as a comparison with similar homes in the area
Home Values in the Area
Average Home Value in this Area
Purchase History
| Date | Buyer | Sale Price | Title Company |
|---|---|---|---|
| Foster John R | -- | None Available | |
| Foster John R | -- | None Available | |
| Collins Lynda Foster | -- | None Available | |
| Collins Lynda Foster | -- | None Available |
Source: Public Records
Tax History Compared to Growth
Tax History
| Year | Tax Paid | Tax Assessment Tax Assessment Total Assessment is a certain percentage of the fair market value that is determined by local assessors to be the total taxable value of land and additions on the property. | Land | Improvement |
|---|---|---|---|---|
| 2025 | $978 | $151,320 | $43,130 | $108,190 |
| 2024 | $973 | $151,320 | $43,130 | $108,190 |
| 2023 | $808 | $81,110 | $14,250 | $66,860 |
| 2022 | $798 | $81,110 | $14,250 | $66,860 |
| 2021 | $806 | $81,110 | $14,250 | $66,860 |
| 2020 | $810 | $81,110 | $14,250 | $66,860 |
| 2019 | $800 | $81,110 | $14,250 | $66,860 |
| 2018 | $795 | $81,110 | $14,250 | $66,860 |
| 2017 | $493 | $42,560 | $12,950 | $29,610 |
| 2016 | $508 | $42,560 | $12,950 | $29,610 |
| 2015 | $508 | $42,560 | $12,950 | $29,610 |
| 2014 | $460 | $42,560 | $12,950 | $29,610 |
Source: Public Records
Map
Nearby Homes
- 11 Tillery Dr
- 09 Tillery Dr
- 06 Tillery Dr
- 08 Tillery Dr
- 0 Sutton Rd
- 70 Acres Sutton Rd
- 4224 Us 401 Hwy N
- 592 Perdues Rd
- 76 Sutton Rd
- 2329 N Carolina 561
- 307 Wilson-Fuller Rd
- 376 T K Allen Rd
- 35 Jonesville Ln
- 0 Zinnia Ct Unit 10129898
- 2253 Pete Smith Rd
- 0 Beasley Rd Unit 10130664
- 641 Rocky Ford Rd
- 0 Alert Rd
- 979 Alert Rd
- 994 Alert Rd
- 248 Pete Smith Rd
- 213 Pete Smith Rd
- 229 Pete Smith Rd
- 186 Pete Smith Rd
- 177 Pete Smith Rd
- 153 Pete Smith Rd
- 147 Pete Smith Rd
- 319 Pete Smith Rd
- 136 Pete Smith Rd
- 123 Pete Smith Rd
- 395 Pete Smith Rd
- 000 Coppedge Ln
- 0 Coppedge Ln Unit LOT 9
- 000 Coppedge Ln Unit 5
- 125 Pete Smith Rd
- 1490 Duke Valentine Wynne Rd
- 1567 Duke Valentine Wynne Rd
- 160 Harris Jones Rd
- 1501 Duke Valentine Wynne Rd
- 262 Coppedge Ln