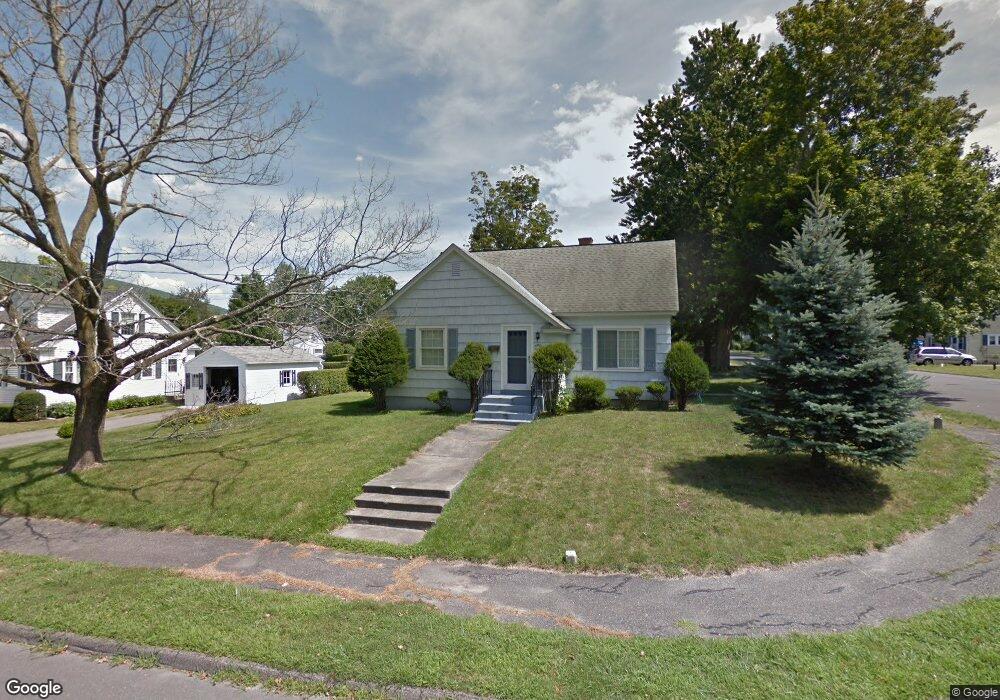
220 Phelps Ave North Adams, MA 01247
Estimated Value: $248,000 - $306,000
3
Beds
2
Baths
1,664
Sq Ft
$162/Sq Ft
Est. Value
About This Home
This home is located at 220 Phelps Ave, North Adams, MA 01247 and is currently estimated at $269,538, approximately $161 per square foot. 220 Phelps Ave is a home located in Berkshire County with nearby schools including Greylock Elementary School, Drury High School, and Pine Cobble School.
Ownership History
Date
Name
Owned For
Owner Type
Purchase Details
Closed on
Jul 1, 2013
Sold by
Molloy Shelley A
Bought by
Molloy Christopher A
Current Estimated Value
Home Financials for this Owner
Home Financials are based on the most recent Mortgage that was taken out on this home.
Original Mortgage
$115,000
Outstanding Balance
$25,843
Interest Rate
3.51%
Mortgage Type
New Conventional
Estimated Equity
$243,695
Purchase Details
Closed on
Jun 15, 2011
Sold by
Fnma
Bought by
Molloy Christopher A and Molloy Shelley A
Purchase Details
Closed on
Mar 24, 2011
Sold by
Silvia Glenn P and Bac Home Loan Svcng Lp
Bought by
Federal National Mortgage Association
Purchase Details
Closed on
Sep 1, 2005
Sold by
Willard Raymond D and Willard Terry R
Bought by
Silvia Frances M and Silvia Glenn P
Purchase Details
Closed on
Aug 24, 1987
Sold by
Siciliano Jerry
Bought by
Willard Raymond D
Create a Home Valuation Report for This Property
The Home Valuation Report is an in-depth analysis detailing your home's value as well as a comparison with similar homes in the area
Home Values in the Area
Average Home Value in this Area
Purchase History
| Date | Buyer | Sale Price | Title Company |
|---|---|---|---|
| Molloy Christopher A | -- | -- | |
| Molloy Christopher A | $119,500 | -- | |
| Federal National Mortgage Association | $139,028 | -- | |
| Silvia Frances M | $168,200 | -- | |
| Molloy Christopher A | -- | -- | |
| Molloy Christopher A | $119,500 | -- | |
| Federal National Mortgage Association | $139,028 | -- | |
| Silvia Frances M | $168,200 | -- | |
| Willard Raymond D | $87,500 | -- |
Source: Public Records
Mortgage History
| Date | Status | Borrower | Loan Amount |
|---|---|---|---|
| Open | Willard Raymond D | $115,000 | |
| Closed | Willard Raymond D | $115,000 |
Source: Public Records
Tax History Compared to Growth
Tax History
| Year | Tax Paid | Tax Assessment Tax Assessment Total Assessment is a certain percentage of the fair market value that is determined by local assessors to be the total taxable value of land and additions on the property. | Land | Improvement |
|---|---|---|---|---|
| 2025 | $4,002 | $239,500 | $45,100 | $194,400 |
| 2024 | $3,755 | $219,100 | $41,200 | $177,900 |
| 2023 | $3,640 | $206,000 | $41,200 | $164,800 |
| 2022 | $3,308 | $178,500 | $41,200 | $137,300 |
| 2021 | $3,076 | $165,300 | $38,200 | $127,100 |
| 2020 | $2,851 | $153,100 | $37,900 | $115,200 |
| 2019 | $2,677 | $140,100 | $35,000 | $105,100 |
| 2018 | $2,571 | $139,900 | $36,800 | $103,100 |
| 2017 | $2,449 | $138,600 | $36,500 | $102,100 |
| 2016 | $2,377 | $136,700 | $36,500 | $100,200 |
| 2015 | $2,282 | $136,700 | $36,500 | $100,200 |
Source: Public Records
Map
Nearby Homes