Estimated Value: $190,000 - $222,000
2
Beds
2
Baths
1,433
Sq Ft
$148/Sq Ft
Est. Value
About This Home
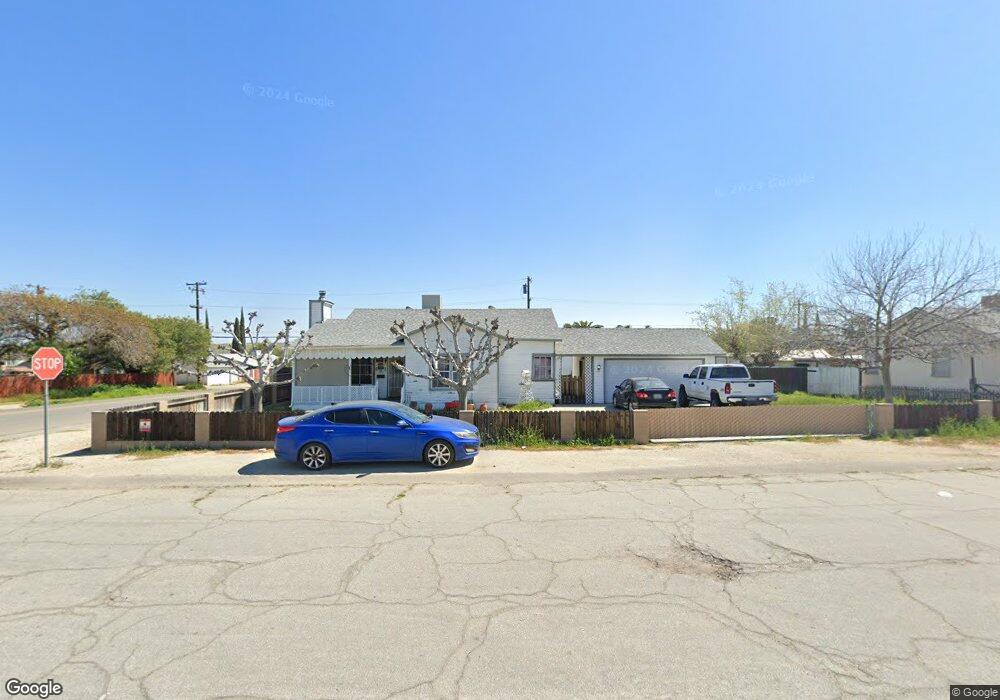
This home is located at 220 Pierce St, Taft, CA 93268 and is currently estimated at $211,431, approximately $147 per square foot. 220 Pierce St is a home located in Kern County with nearby schools including Jefferson Elementary School, Roosevelt Elementary School, and Lincoln Junior High School.
Ownership History
Date
Name
Owned For
Owner Type
Purchase Details
Closed on
Oct 14, 2021
Sold by
Tweedy Lisa
Bought by
Tweedy Lisa and Kendall Lindsay Elizabeth
Current Estimated Value
Purchase Details
Closed on
Jun 30, 2000
Sold by
Russell Max G and Russell Wanda L
Bought by
Tweedy Lance and Tweedy Lisa
Purchase Details
Closed on
Mar 24, 1994
Sold by
Pollock John H and Pollock Sarah R
Bought by
Russell Max G and Russell Wanda L
Home Financials for this Owner
Home Financials are based on the most recent Mortgage that was taken out on this home.
Original Mortgage
$44,000
Interest Rate
7.21%
Create a Home Valuation Report for This Property
The Home Valuation Report is an in-depth analysis detailing your home's value as well as a comparison with similar homes in the area
Home Values in the Area
Average Home Value in this Area
Purchase History
We collect this data history from publicly available records. To have your information removed, we recommend requesting removal directly through your county’s website.
| Date | Buyer | Sale Price | Title Company |
|---|---|---|---|
| Tweedy Lisa | -- | None Available | |
| Tweedy Lance | $66,000 | American Title Co | |
| Russell Max G | $55,000 | Century Title & Guaranty Co |
Source: Public Records
Mortgage History
We collect this data history from publicly available records. To have your information removed, we recommend requesting removal directly through your county’s website.
| Date | Status | Borrower | Loan Amount |
|---|---|---|---|
| Previous Owner | Russell Max G | $44,000 |
Source: Public Records
Tax History
| Year | Tax Paid | Tax Assessment Tax Assessment Total Assessment is a certain percentage of the fair market value that is determined by local assessors to be the total taxable value of land and additions on the property. | Land | Improvement |
|---|---|---|---|---|
| 2025 | $2,321 | $99,427 | $30,125 | $69,302 |
| 2024 | $2,102 | $97,479 | $29,535 | $67,944 |
| 2023 | $2,102 | $95,568 | $28,956 | $66,612 |
| 2022 | $1,922 | $93,695 | $28,389 | $65,306 |
| 2021 | $1,833 | $91,859 | $27,833 | $64,026 |
| 2020 | $1,833 | $90,918 | $27,548 | $63,370 |
| 2019 | $1,664 | $90,918 | $27,548 | $63,370 |
| 2018 | $1,612 | $87,389 | $26,479 | $60,910 |
| 2017 | $1,573 | $85,676 | $25,960 | $59,716 |
| 2016 | $1,600 | $83,997 | $25,451 | $58,546 |
| 2015 | $1,482 | $82,736 | $25,069 | $57,667 |
| 2014 | $1,255 | $68,000 | $17,000 | $51,000 |
Source: Public Records
Map
Nearby Homes
- 207 Fillmore St
- 118 Pierce St
- 615 Buchanan St
- 305 Tyler St
- tyler Tyler St
- 412 N Lincoln St
- 303 Harrison St
- 116 W Ash St
- 410 Harrison St
- 401 Van Buren St
- 473 Cedar St
- 604 Taylor St
- 629 Woodrow St
- 707 Fillmore St
- 708 Pierce St
- 708 1/2 Fillmore St
- 613 Woodrow St
- 0 San Emidio St
- 706 Polk St
- 312 Madison St
- 209 Fillmore St
- 205 Fillmore St
- 211 Fillmore St
- 203 Fillmore St
- 213 Fillmore St
- 201 Fillmore St
- 208 Pierce St
- 204 Pierce St
- 210 Pierce St
- 215 Fillmore St
- 206 Fillmore St
- 208 Fillmore St
- 202 Pierce St
- 204 Fillmore St
- 200 Pierce St
- 210 Fillmore St
- 212 Pierce St
- 202 Fillmore St
- 212 Fillmore St
- 200 1/2 Fillmore St
Your Personal Tour Guide
Ask me questions while you tour the home.