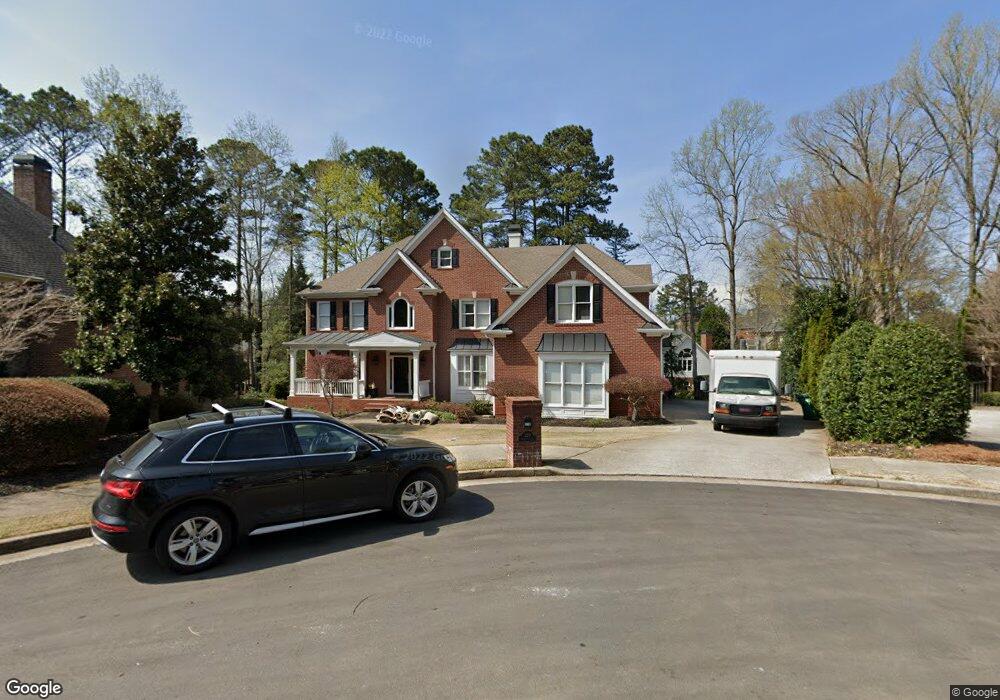
220 Radlett Ln Unit XI Alpharetta, GA 30022
Estimated Value: $1,123,813 - $1,293,000
5
Beds
4
Baths
3,716
Sq Ft
$330/Sq Ft
Est. Value
About This Home
This home is located at 220 Radlett Ln Unit XI, Alpharetta, GA 30022 and is currently estimated at $1,227,203, approximately $330 per square foot. 220 Radlett Ln Unit XI is a home located in Fulton County with nearby schools including New Prospect Elementary School, Webb Bridge Middle School, and Alpharetta High School.
Ownership History
Date
Name
Owned For
Owner Type
Purchase Details
Closed on
Mar 14, 2003
Sold by
Cohen Neil
Bought by
Cohen Neil and Cohen Karen
Current Estimated Value
Home Financials for this Owner
Home Financials are based on the most recent Mortgage that was taken out on this home.
Original Mortgage
$455,000
Interest Rate
4.75%
Mortgage Type
Unknown
Purchase Details
Closed on
Oct 10, 2001
Sold by
Jim Hogan Homes Inc
Bought by
Graham Brian P and Graham Barbara J
Home Financials for this Owner
Home Financials are based on the most recent Mortgage that was taken out on this home.
Original Mortgage
$425,000
Interest Rate
6.85%
Mortgage Type
New Conventional
Create a Home Valuation Report for This Property
The Home Valuation Report is an in-depth analysis detailing your home's value as well as a comparison with similar homes in the area
Home Values in the Area
Average Home Value in this Area
Purchase History
| Date | Buyer | Sale Price | Title Company |
|---|---|---|---|
| Cohen Neil | -- | -- | |
| Cohen Neil | $608,000 | -- | |
| Cohen Neil | -- | -- | |
| Cohen Neil | $600,000 | -- | |
| Graham Brian P | $566,300 | -- |
Source: Public Records
Mortgage History
| Date | Status | Borrower | Loan Amount |
|---|---|---|---|
| Previous Owner | Cohen Neil | $455,000 | |
| Previous Owner | Graham Brian P | $425,000 |
Source: Public Records
Tax History Compared to Growth
Tax History
| Year | Tax Paid | Tax Assessment Tax Assessment Total Assessment is a certain percentage of the fair market value that is determined by local assessors to be the total taxable value of land and additions on the property. | Land | Improvement |
|---|---|---|---|---|
| 2025 | $1,370 | $417,360 | $135,760 | $281,600 |
| 2023 | $9,959 | $352,840 | $89,320 | $263,520 |
| 2022 | $6,170 | $285,960 | $65,600 | $220,360 |
| 2021 | $7,336 | $257,120 | $65,440 | $191,680 |
| 2020 | $7,388 | $258,800 | $49,840 | $208,960 |
| 2019 | $1,173 | $254,240 | $48,960 | $205,280 |
| 2018 | $7,727 | $297,640 | $47,840 | $249,800 |
| 2017 | $7,409 | $269,360 | $50,400 | $218,960 |
| 2016 | $7,374 | $269,360 | $50,400 | $218,960 |
| 2015 | $8,749 | $269,360 | $50,400 | $218,960 |
| 2014 | $7,290 | $250,560 | $46,880 | $203,680 |
Source: Public Records
Map
Nearby Homes
- 3010 Brooke View Ct Unit 5
- 4255 Park Brooke Trace
- 870 Longstone Landing
- 4345 Park Brooke Trace
- 3750 Brookside Pkwy Unit 37413033
- 4465 Park Brooke Trace Unit 5
- 5008 Avalon Dr
- 437 Argosy Park Cir
- 345 Kincardine Way Unit IIIA
- 3087 Camden Way
- 3962 Erin Dr
- 3015 Camden Way
- 3027 Camden Way
- 3965 Brookline Dr
- 105 Kimball Bridge Cove
- 10900 Wittenridge Dr Unit I3
- 10900 Wittenridge Dr Unit H8
- 10900 Wittenridge Dr Unit L6
- 465 Kirkstall Trail
- 230 Radlett Ln
- 0 Radlett Ln Unit 7520484
- 210 Radlett Ln Unit XI
- 580 Barnesley Ln Unit XI
- 570 Barnesley Ln
- 560 Barnesley Ln
- 550 Barnesley Ln
- 300 N Saint Phillip Ln Unit XI
- 235 Radlett Ln Unit XI
- 200 Radlett Ln Unit XI
- 225 Radlett Ln Unit XI
- 215 Radlett Ln
- 615 Barnesley Ln
- 540 Barnesley Ln Unit IX
- 540 Barnesley Ln
- 540 Barnesley Ln Unit 1X
- 605 Barnesley Ln
- 530 Barnesley Ln Unit IX
- 330 N Saint Phillip Ln
- N N Saint Phillip Ln