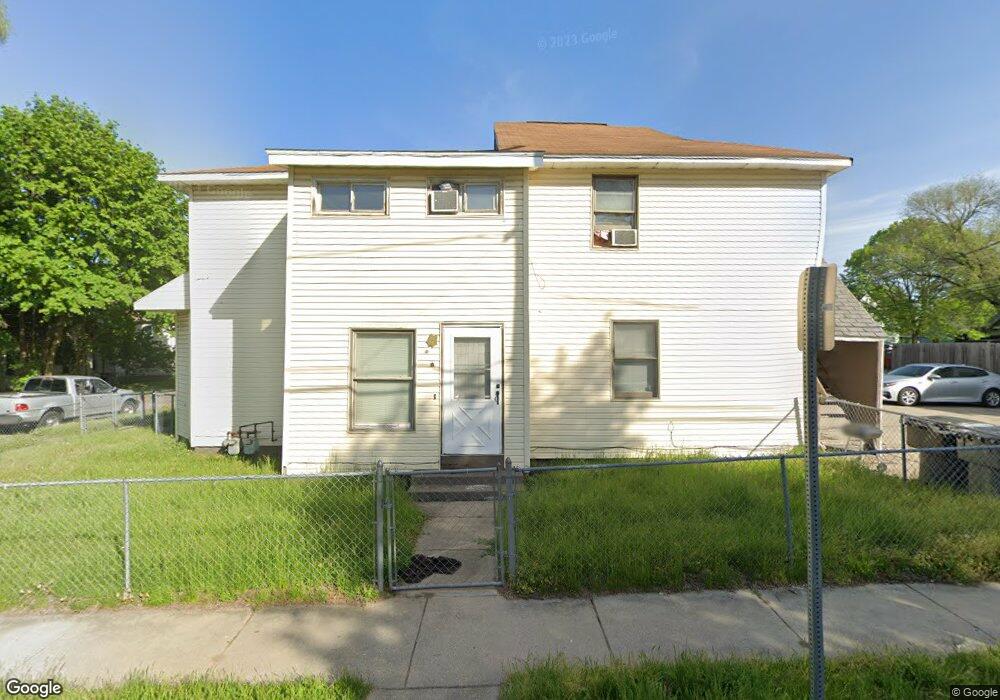
220 Redding Ave Elkhart, IN 46516
Indiana NeighborhoodEstimated Value: $165,000 - $265,000
4
Beds
1
Bath
3,272
Sq Ft
$60/Sq Ft
Est. Value
About This Home
This home is located at 220 Redding Ave, Elkhart, IN 46516 and is currently estimated at $195,428, approximately $59 per square foot. 220 Redding Ave is a home located in Elkhart County with nearby schools including Mary Beck Elementary School, North Side Middle School, and Elkhart High School's Freshman Division.
Ownership History
Date
Name
Owned For
Owner Type
Purchase Details
Closed on
Oct 22, 2019
Sold by
Otterbridge James H
Bought by
Applewhite Collin
Current Estimated Value
Home Financials for this Owner
Home Financials are based on the most recent Mortgage that was taken out on this home.
Original Mortgage
$56,250
Outstanding Balance
$49,066
Interest Rate
3.4%
Mortgage Type
New Conventional
Estimated Equity
$146,362
Create a Home Valuation Report for This Property
The Home Valuation Report is an in-depth analysis detailing your home's value as well as a comparison with similar homes in the area
Home Values in the Area
Average Home Value in this Area
Purchase History
| Date | Buyer | Sale Price | Title Company |
|---|---|---|---|
| Applewhite Collin | $74,812 | None Listed On Document |
Source: Public Records
Mortgage History
| Date | Status | Borrower | Loan Amount |
|---|---|---|---|
| Open | Applewhite Collin | $56,250 |
Source: Public Records
Tax History Compared to Growth
Tax History
| Year | Tax Paid | Tax Assessment Tax Assessment Total Assessment is a certain percentage of the fair market value that is determined by local assessors to be the total taxable value of land and additions on the property. | Land | Improvement |
|---|---|---|---|---|
| 2024 | $3,458 | $170,200 | $10,600 | $159,600 |
| 2022 | $3,254 | $92,500 | $10,600 | $81,900 |
| 2021 | $1,891 | $92,500 | $10,600 | $81,900 |
| 2020 | $2,738 | $126,100 | $10,600 | $115,500 |
| 2019 | $2,482 | $114,700 | $10,600 | $104,100 |
| 2018 | $1,316 | $60,100 | $5,400 | $54,700 |
| 2017 | $1,320 | $60,100 | $5,400 | $54,700 |
| 2016 | $1,316 | $60,100 | $5,400 | $54,700 |
| 2014 | $1,281 | $60,100 | $5,400 | $54,700 |
| 2013 | $1,528 | $76,400 | $14,000 | $62,400 |
Source: Public Records
Map
Nearby Homes
- 1011 Benham Ct
- 916 Madison St
- 529 S 2nd St
- 1308 Eden St
- 315 Division St
- 421 W Garfield Ave
- 1524 Frances Ave
- 607 W Marion St
- 419 W High St
- 721 Harrison St
- 710 E Indiana Ave
- 409 W Wolf Ave
- 311 Hillside Ct
- 301 W Jackson Blvd
- 226/228 & 230 W Jackson St
- 302 W Jackson Blvd
- 714 W Blaine Ave
- 2009 Roys Ave
- 1537 Moyer Ave
- 1007 Mason St