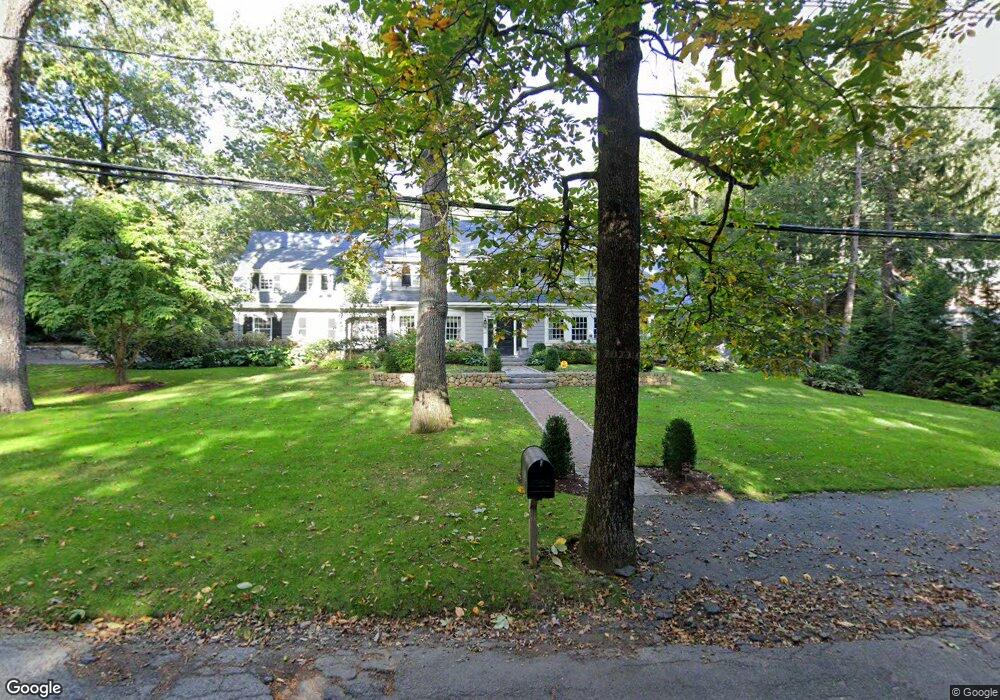
220 Ridgeway Rd Weston, MA 02493
Estimated Value: $3,080,000 - $3,709,000
5
Beds
5
Baths
5,432
Sq Ft
$616/Sq Ft
Est. Value
About This Home
This home is located at 220 Ridgeway Rd, Weston, MA 02493 and is currently estimated at $3,348,108, approximately $616 per square foot. 220 Ridgeway Rd is a home located in Middlesex County with nearby schools including Country Elementary School, Woodland Elementary School, and Field Elementary School.
Ownership History
Date
Name
Owned For
Owner Type
Purchase Details
Closed on
Sep 26, 2006
Sold by
Gardner Alan M and Gardner Laryn I
Bought by
Gardner Alan M and Gardner Laryn I
Current Estimated Value
Purchase Details
Closed on
Jul 20, 2006
Sold by
Lewis-Solomont Susan
Bought by
Gardner Alan M and Gardner Laryn I
Purchase Details
Closed on
Jun 26, 1987
Sold by
Ogilvie Andrew J
Bought by
Solomont Alan D
Create a Home Valuation Report for This Property
The Home Valuation Report is an in-depth analysis detailing your home's value as well as a comparison with similar homes in the area
Home Values in the Area
Average Home Value in this Area
Purchase History
| Date | Buyer | Sale Price | Title Company |
|---|---|---|---|
| Gardner Alan M | -- | -- | |
| Gardner Alan M | $2,111,500 | -- | |
| Solomont Alan D | $735,000 | -- |
Source: Public Records
Mortgage History
| Date | Status | Borrower | Loan Amount |
|---|---|---|---|
| Open | Solomont Alan D | $1,490,000 | |
| Closed | Solomont Alan D | $1,490,000 | |
| Closed | Solomont Alan D | $1,500,000 |
Source: Public Records
Tax History
| Year | Tax Paid | Tax Assessment Tax Assessment Total Assessment is a certain percentage of the fair market value that is determined by local assessors to be the total taxable value of land and additions on the property. | Land | Improvement |
|---|---|---|---|---|
| 2025 | $32,029 | $2,885,500 | $1,118,400 | $1,767,100 |
| 2024 | $31,200 | $2,805,800 | $1,118,400 | $1,687,400 |
| 2023 | $30,885 | $2,608,500 | $1,118,400 | $1,490,100 |
| 2022 | $30,093 | $2,349,200 | $1,065,400 | $1,283,800 |
| 2021 | $29,075 | $2,240,000 | $1,016,700 | $1,223,300 |
| 2020 | $27,815 | $2,168,000 | $1,016,700 | $1,151,300 |
| 2019 | $26,246 | $2,084,700 | $941,600 | $1,143,100 |
| 2018 | $6,304 | $2,111,300 | $941,600 | $1,169,700 |
| 2017 | $6,323 | $2,111,300 | $941,600 | $1,169,700 |
| 2016 | $25,673 | $2,111,300 | $941,600 | $1,169,700 |
| 2015 | $24,238 | $1,973,800 | $837,600 | $1,136,200 |
Source: Public Records
Map
Nearby Homes
Your Personal Tour Guide
Ask me questions while you tour the home.