220 Rolling Rd Gaithersburg, MD 20877
Gaithersburg AreaEstimated Value: $554,000 - $590,000
About This Home
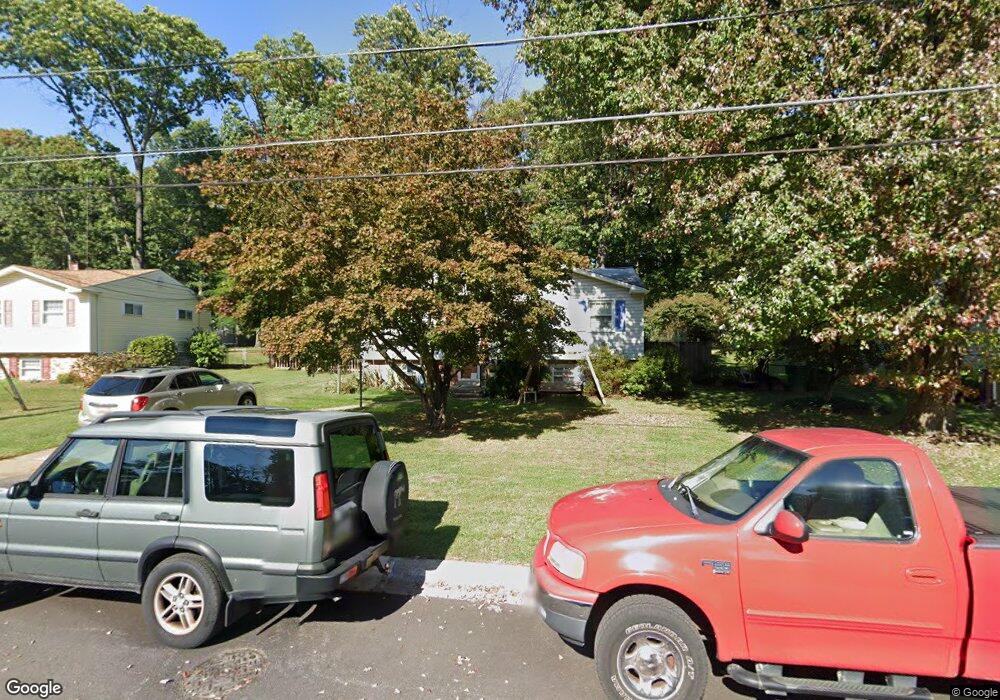
This home is located at 220 Rolling Rd, Gaithersburg, MD 20877 and is currently estimated at $568,151, approximately $494 per square foot. 220 Rolling Rd is a home located in Montgomery County with nearby schools including Forest Oak Middle School, Gaithersburg High School, and St Martin Of Tours School.
Ownership History
We collect this data history from publicly available records. To have your information removed, we recommend requesting removal directly through your county’s website.
Purchase Details
Home Financials for this Owner
Home Financials are based on the most recent Mortgage that was taken out on this home.Purchase Details
Home Values in the Area
Average Home Value in this Area
Purchase History
We collect this data history from publicly available records. To have your information removed, we recommend requesting removal directly through your county’s website.
| Date | Buyer | Sale Price | Title Company |
|---|---|---|---|
| -- | First American Equity Loan S | ||
| $290,000 | -- |
Mortgage History
We collect this data history from publicly available records. To have your information removed, we recommend requesting removal directly through your county’s website.
| Date | Status | Borrower | Loan Amount |
|---|---|---|---|
| Open | $326,100 | ||
| Closed | $342,250 | ||
| Closed | $25,000 | ||
| Closed | $100,000 |
Tax History
We collect this data history from publicly available records. To have your information removed, we recommend requesting removal directly through your county’s website.
| Year | Tax Paid | Tax Assessment Tax Assessment Total Assessment is a certain percentage of the fair market value that is determined by local assessors to be the total taxable value of land and additions on the property. | Land | Improvement |
|---|---|---|---|---|
| 2025 | $5,455 | $442,433 | ||
| 2024 | $5,840 | $423,067 | $0 | $0 |
| 2023 | $4,860 | $403,700 | $254,000 | $149,700 |
| 2022 | $4,570 | $391,033 | $0 | $0 |
| 2021 | $4,244 | $378,367 | $0 | $0 |
| 2020 | $4,244 | $365,700 | $223,900 | $141,800 |
| 2019 | $4,056 | $352,233 | $0 | $0 |
| 2018 | $3,855 | $338,767 | $0 | $0 |
| 2017 | $3,730 | $325,300 | $0 | $0 |
| 2016 | -- | $311,633 | $0 | $0 |
| 2015 | $4,068 | $297,967 | $0 | $0 |
| 2014 | $4,068 | $284,300 | $0 | $0 |
Map
- 436 - 438 Diamond Ave
- 14 Standard Ct
- 34 Federal Ct
- 122 E Deer Park Dr
- 22 Benji Ct
- 46 State Ct
- 431 Gaither St
- 434 Gaither St
- 42 Brian Ct
- 38 Steven Ct
- 76 Nina Ct
- 206 Grove Ave
- 8611 Oakmont St
- 412 Girard St Unit 204
- 460 Girard St Unit 204
- 416 Girard St Unit T2
- 458 Girard St Unit T2
- 450 Girard St Unit 304
- 97 Central Ave
- 95 Central Ave
Ask me questions while you tour the home.