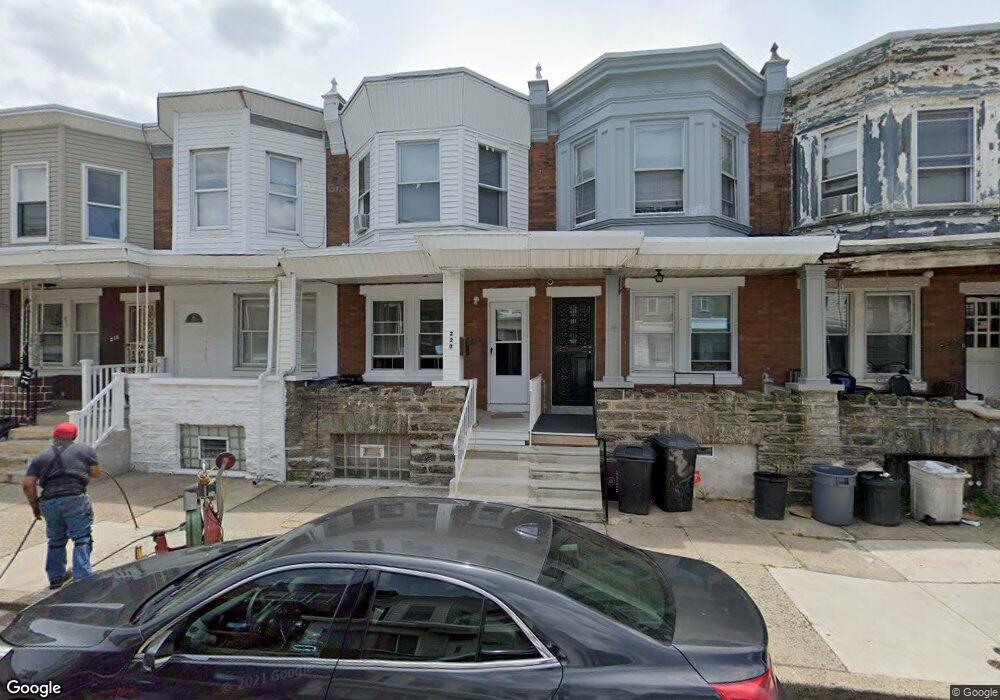
220 Rubicam St Philadelphia, PA 19120
Olney NeighborhoodEstimated Value: $104,000 - $165,247
3
Beds
1
Bath
1,120
Sq Ft
$126/Sq Ft
Est. Value
About This Home
This home is located at 220 Rubicam St, Philadelphia, PA 19120 and is currently estimated at $141,312, approximately $126 per square foot. 220 Rubicam St is a home located in Philadelphia County with nearby schools including Andrew J. Morrison School, Birney Preparatory Academy, and Olney Charter High School.
Ownership History
Date
Name
Owned For
Owner Type
Purchase Details
Closed on
Jan 10, 2019
Sold by
I O M Inc
Bought by
Thompson Cecil P
Current Estimated Value
Home Financials for this Owner
Home Financials are based on the most recent Mortgage that was taken out on this home.
Original Mortgage
$75,113
Outstanding Balance
$67,190
Interest Rate
5.5%
Mortgage Type
FHA
Estimated Equity
$74,122
Purchase Details
Closed on
Aug 9, 2017
Sold by
Wells Fargo Bank N A
Bought by
L O M Inc
Purchase Details
Closed on
Jun 9, 2017
Sold by
Outen Sonya R and Wells Fargo Bank N A
Bought by
Wells Fargo Bank N A
Purchase Details
Closed on
Mar 14, 2003
Sold by
Miller Celia M
Bought by
Outen Sonya R
Home Financials for this Owner
Home Financials are based on the most recent Mortgage that was taken out on this home.
Original Mortgage
$44,101
Interest Rate
5.9%
Mortgage Type
FHA
Purchase Details
Closed on
Dec 8, 1994
Sold by
Zeallor Richard L and Zeallor John Albert
Bought by
Miller Celia M
Create a Home Valuation Report for This Property
The Home Valuation Report is an in-depth analysis detailing your home's value as well as a comparison with similar homes in the area
Home Values in the Area
Average Home Value in this Area
Purchase History
| Date | Buyer | Sale Price | Title Company |
|---|---|---|---|
| Thompson Cecil P | $76,500 | Amrock | |
| L O M Inc | $21,750 | Boston National Title Llc | |
| Wells Fargo Bank N A | $15,900 | None Available | |
| Outen Sonya R | $44,000 | -- | |
| Miller Celia M | $12,000 | -- |
Source: Public Records
Mortgage History
| Date | Status | Borrower | Loan Amount |
|---|---|---|---|
| Open | Thompson Cecil P | $75,113 | |
| Previous Owner | Outen Sonya R | $44,101 |
Source: Public Records
Tax History Compared to Growth
Tax History
| Year | Tax Paid | Tax Assessment Tax Assessment Total Assessment is a certain percentage of the fair market value that is determined by local assessors to be the total taxable value of land and additions on the property. | Land | Improvement |
|---|---|---|---|---|
| 2025 | $1,376 | $131,800 | $26,360 | $105,440 |
| 2024 | $1,376 | $131,800 | $26,360 | $105,440 |
| 2023 | $1,376 | $98,300 | $19,660 | $78,640 |
| 2022 | $1,022 | $98,300 | $19,660 | $78,640 |
| 2021 | $1,022 | $0 | $0 | $0 |
| 2020 | $1,022 | $0 | $0 | $0 |
| 2019 | $950 | $0 | $0 | $0 |
| 2018 | $1,009 | $0 | $0 | $0 |
| 2017 | $1,009 | $0 | $0 | $0 |
| 2016 | $589 | $0 | $0 | $0 |
| 2015 | $564 | $0 | $0 | $0 |
| 2014 | -- | $72,100 | $4,823 | $67,277 |
| 2012 | -- | $9,056 | $723 | $8,333 |
Source: Public Records
Map
Nearby Homes
- 5150 N 2nd St
- 239 Rubicam St
- 258 W Sheldon St
- 224 W Duncannon Ave
- 267 W Sheldon St
- 246 W Duncannon Ave
- 267 Rubicam St
- 4993 N 2nd St
- 4987 N 2nd St
- 313 Lindley Ave
- 5228 N 2nd St
- 5230 N 2nd St
- 207 W Albanus St
- 253 W Albanus St
- 161 W Roosevelt Blvd
- 159 W Roosevelt Blvd
- 157 W Roosevelt Blvd
- 163 W Roosevelt Blvd
- 155 W Roosevelt Blvd
- 153 W Roosevelt Blvd
- 218 Rubicam St
- 222 Rubicam St
- 216 Rubicam St
- 224 Rubicam St
- 214 Rubicam St
- 226 Rubicam St
- 228 Rubicam St
- 212 Rubicam St
- 210 Rubicam St
- 230 Rubicam St
- 217 W Sheldon St
- 208 Rubicam St
- 215 W Sheldon St
- 219 W Sheldon St
- 232 Rubicam St
- 213 W Sheldon St
- 221 W Sheldon St
- 223 W Sheldon St
- 211 W Sheldon St
- 221 Rubicam St