Estimated Value: $113,547 - $143,000
4
Beds
2
Baths
1,620
Sq Ft
$82/Sq Ft
Est. Value
About This Home
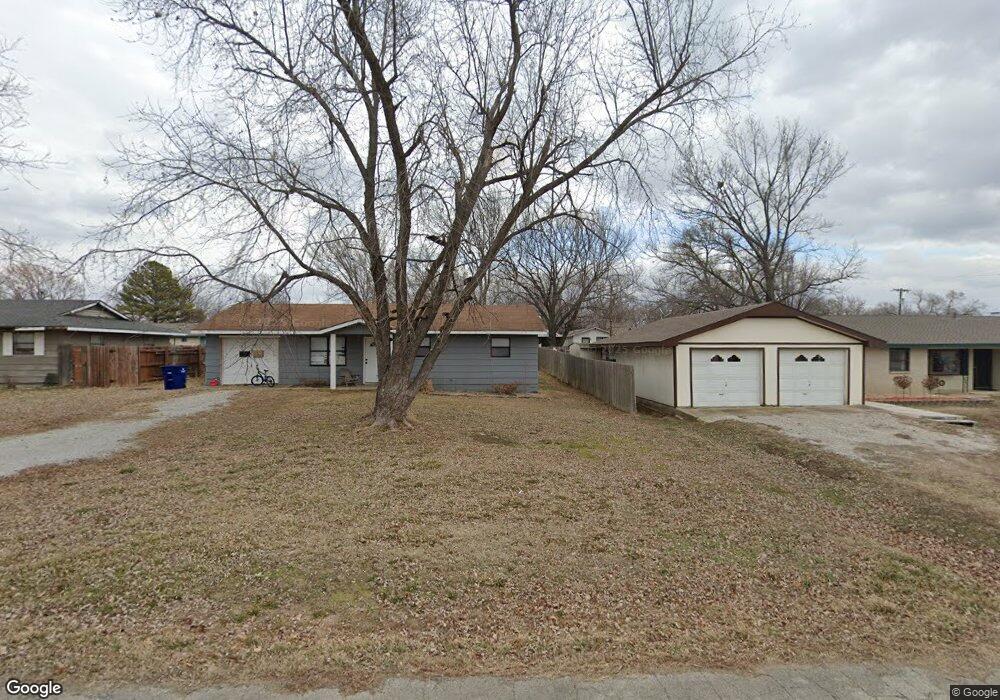
This home is located at 220 S Chestnut St, Copan, OK 74022 and is currently estimated at $132,387, approximately $81 per square foot. 220 S Chestnut St is a home located in Washington County with nearby schools including Copan Elementary School and Copan High School.
Ownership History
Date
Name
Owned For
Owner Type
Purchase Details
Closed on
Jan 30, 2015
Sold by
Moreland Delbert Warren
Bought by
Faulkner Mary C
Current Estimated Value
Home Financials for this Owner
Home Financials are based on the most recent Mortgage that was taken out on this home.
Original Mortgage
$71,938
Outstanding Balance
$55,081
Interest Rate
3.83%
Mortgage Type
New Conventional
Estimated Equity
$77,306
Purchase Details
Closed on
Jan 31, 1984
Sold by
Moreland Perlie Ruth and Moreland Delbert~War
Purchase Details
Closed on
Jan 19, 1984
Sold by
Moreland Perlie Ruth and Moreland Delbert~War
Create a Home Valuation Report for This Property
The Home Valuation Report is an in-depth analysis detailing your home's value as well as a comparison with similar homes in the area
Home Values in the Area
Average Home Value in this Area
Purchase History
| Date | Buyer | Sale Price | Title Company |
|---|---|---|---|
| Faulkner Mary C | $70,000 | None Available | |
| -- | -- | -- | |
| -- | -- | -- |
Source: Public Records
Mortgage History
| Date | Status | Borrower | Loan Amount |
|---|---|---|---|
| Open | Faulkner Mary C | $71,938 |
Source: Public Records
Tax History Compared to Growth
Tax History
| Year | Tax Paid | Tax Assessment Tax Assessment Total Assessment is a certain percentage of the fair market value that is determined by local assessors to be the total taxable value of land and additions on the property. | Land | Improvement |
|---|---|---|---|---|
| 2025 | $490 | $5,672 | $172 | $5,500 |
| 2024 | $472 | $5,402 | $164 | $5,238 |
| 2023 | $472 | $5,145 | $163 | $4,982 |
| 2022 | $421 | $5,144 | $163 | $4,981 |
| 2021 | $413 | $4,667 | $160 | $4,507 |
| 2020 | $377 | $4,444 | $158 | $4,286 |
| 2019 | $362 | $4,232 | $156 | $4,076 |
| 2018 | $345 | $4,031 | $155 | $3,876 |
| 2017 | $328 | $3,839 | $153 | $3,686 |
| 2016 | $310 | $3,656 | $152 | $3,504 |
| 2015 | $302 | $3,482 | $150 | $3,332 |
| 2014 | $222 | $2,530 | $109 | $2,421 |
Source: Public Records
Map
Nearby Homes
- 302 S Chestnut St
- 400 S Caney St
- 412 E Golden Ave
- 1051 N Caney St
- N 3975th Rd
- 9680 N 3975 Rd
- 0 Rural Route Unit 24764392
- 9635 N 3990 Rd
- 401341 Oklahoma 10
- 000 W 1000 Rd
- 0000 W 1000 Rd
- 0 W 1100 Rd
- W W 1100 Rd
- 190Ac 4 Mile Rd
- 5 N 3990 Rd
- 6 N 3990 Rd
- 8 N 3990 Rd
- 2 N 3990 Rd
- 398990 W 450 Rd
- 396950 W 1300 Rd
- 208 S Chestnut St
- 210 S Chestnut St
- 206 S Chestnut St
- 207 S Chestnut St
- 205 S Chestnut St
- 205 S Chestnut St
- 131 S Bryan St
- 137 S Bryan St
- 212 S Chestnut St
- 212 S Chestnut St
- 203 S Chestnut St
- 139 S Bryan St
- 290 S Bryan St
- 214 S Chestnut St
- 134 S Bryan St
- 231 S Chestnut St
- 138 S Bryan St
- 300 S Chestnut St
- 216 S Chestnut St
- 216 S Chestnut St