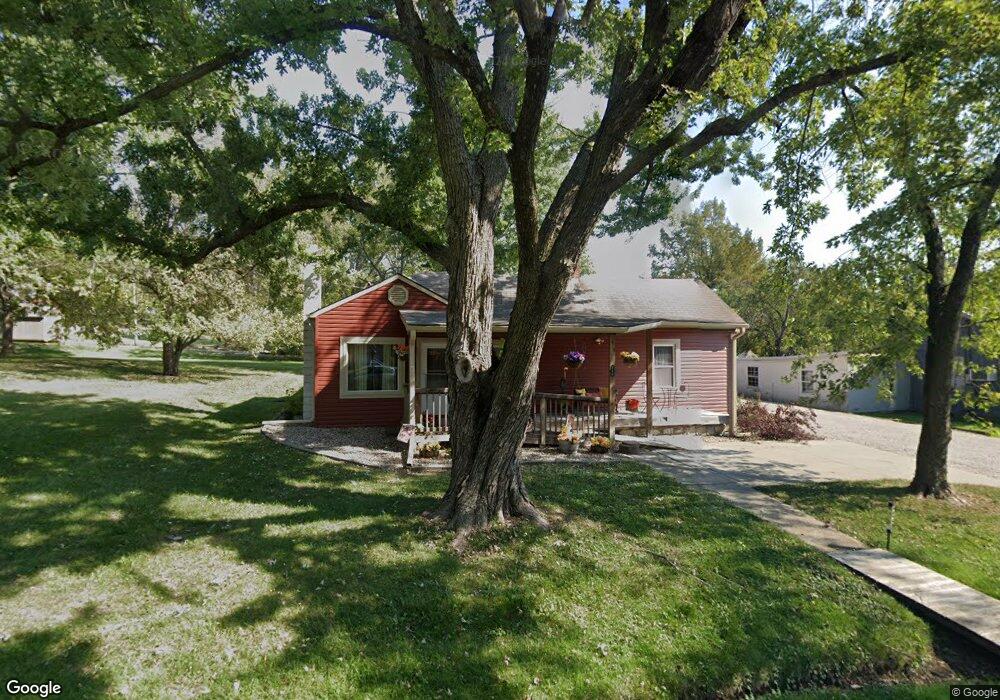
220 S Jeffreys St Pleasant Hill, MO 64080
Estimated Value: $167,000 - $200,000
3
Beds
1
Bath
1,022
Sq Ft
$182/Sq Ft
Est. Value
About This Home
This home is located at 220 S Jeffreys St, Pleasant Hill, MO 64080 and is currently estimated at $185,890, approximately $181 per square foot. 220 S Jeffreys St is a home located in Cass County with nearby schools including Pleasant Hill Primary School, Pleasant Hill Elementary School, and Pleasant Hill Middle School.
Ownership History
Date
Name
Owned For
Owner Type
Purchase Details
Closed on
Apr 21, 2009
Sold by
Federal Home Loan Mortgage Corporation
Bought by
Judd William S and Judd Freeda A
Current Estimated Value
Home Financials for this Owner
Home Financials are based on the most recent Mortgage that was taken out on this home.
Original Mortgage
$40,000
Interest Rate
4.83%
Mortgage Type
New Conventional
Purchase Details
Closed on
Feb 4, 2009
Sold by
Bedell Brian
Bought by
Federal Home Loan Mortgage Corporation
Purchase Details
Closed on
Jan 17, 2006
Sold by
Bedell Brian and Bedell Jennifer A
Bought by
Bedell Brian
Home Financials for this Owner
Home Financials are based on the most recent Mortgage that was taken out on this home.
Original Mortgage
$23,166
Interest Rate
6.15%
Mortgage Type
Credit Line Revolving
Create a Home Valuation Report for This Property
The Home Valuation Report is an in-depth analysis detailing your home's value as well as a comparison with similar homes in the area
Home Values in the Area
Average Home Value in this Area
Purchase History
| Date | Buyer | Sale Price | Title Company |
|---|---|---|---|
| Judd William S | -- | -- | |
| Judd William S | -- | Continental Title Co | |
| Federal Home Loan Mortgage Corporation | $49,176 | -- | |
| Bedell Brian | -- | -- |
Source: Public Records
Mortgage History
| Date | Status | Borrower | Loan Amount |
|---|---|---|---|
| Previous Owner | Judd William S | $40,000 | |
| Previous Owner | Bedell Brian | $23,166 |
Source: Public Records
Tax History Compared to Growth
Tax History
| Year | Tax Paid | Tax Assessment Tax Assessment Total Assessment is a certain percentage of the fair market value that is determined by local assessors to be the total taxable value of land and additions on the property. | Land | Improvement |
|---|---|---|---|---|
| 2024 | $871 | $12,080 | $2,950 | $9,130 |
| 2023 | $865 | $12,080 | $2,950 | $9,130 |
| 2022 | $776 | $10,630 | $2,950 | $7,680 |
| 2021 | $754 | $10,630 | $2,950 | $7,680 |
| 2020 | $692 | $9,990 | $2,950 | $7,040 |
| 2019 | $683 | $9,990 | $2,950 | $7,040 |
| 2018 | $603 | $8,710 | $2,360 | $6,350 |
| 2017 | $584 | $8,710 | $2,360 | $6,350 |
| 2016 | $584 | $8,390 | $2,360 | $6,030 |
| 2015 | $591 | $8,390 | $2,360 | $6,030 |
| 2014 | $547 | $7,730 | $2,360 | $5,370 |
| 2013 | -- | $7,730 | $2,360 | $5,370 |
Source: Public Records
Map
Nearby Homes
- 0 Locust St
- 802 Pine St
- 125 Sitter St
- 213 Sitter St
- 201 Sitter St
- 105 N Campbell St
- 122 N Taylor St
- 1704 Mulberry St
- 1700 Mulberry St
- 218 N Boardman St
- 0 Route 7
- 313 Clearview Dr
- 418 N Taylor St
- 207 Lexington Rd
- 502 N Armstrong St
- 204 Lexington Rd
- 501 Lexington Rd
- 1209 Crest Dr
- 18201 S Hill Top Rd
- 26400 E State Route 58
- 226 S Jeffreys St
- 200 S Jeffreys St
- 219 S Randolph St
- 219 S Jeffreys St
- 213 S Jeffreys St
- 221 S Randolph St
- 522 Locust St
- 203 S Randolph St
- 603 Locust St
- 700 Pine St
- 705 Pine St
- 127 S Randolph St
- 129 S Randolph St
- 0 S Randolph St
- 214 S Randolph St
- 208 S Randolph St
- 700 Locust St
- 523 Locust St Unit 521
- 121 S Randolph St
- 707 Pine St