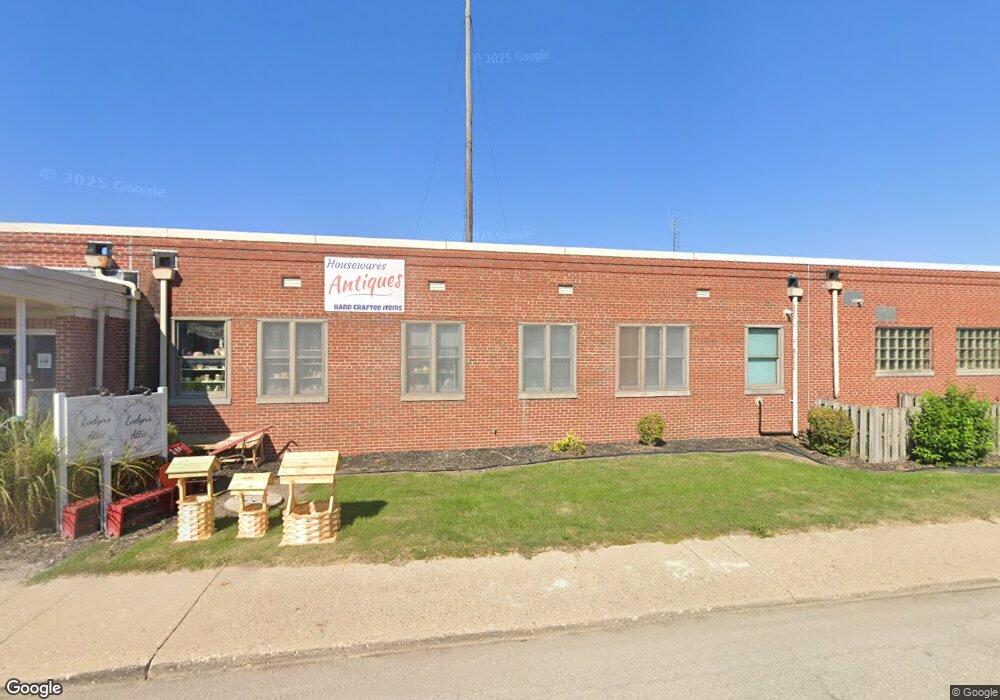
220 S Main St Linden, IN 47955
Estimated Value: $157,000
Studio
--
Bath
9,462
Sq Ft
$17/Sq Ft
Est. Value
About This Home
This home is located at 220 S Main St, Linden, IN 47955 and is currently priced at $157,000, approximately $16 per square foot. 220 S Main St is a home located in Montgomery County with nearby schools including North Montgomery High School.
Ownership History
Date
Name
Owned For
Owner Type
Purchase Details
Closed on
May 29, 2018
Sold by
Smith Darrell and Smith Tammy
Bought by
Smith Taylor J
Current Estimated Value
Create a Home Valuation Report for This Property
The Home Valuation Report is an in-depth analysis detailing your home's value as well as a comparison with similar homes in the area
Purchase History
| Date | Buyer | Sale Price | Title Company |
|---|---|---|---|
| Smith Taylor J | -- | None Available |
Source: Public Records
Tax History
| Year | Tax Paid | Tax Assessment Tax Assessment Total Assessment is a certain percentage of the fair market value that is determined by local assessors to be the total taxable value of land and additions on the property. | Land | Improvement |
|---|---|---|---|---|
| 2024 | $173 | $5,900 | $5,900 | $0 |
| 2023 | $169 | $5,900 | $5,900 | $0 |
| 2022 | $157 | $5,900 | $5,900 | $0 |
| 2021 | $162 | $5,900 | $5,900 | $0 |
| 2020 | $152 | $5,900 | $5,900 | $0 |
| 2019 | $173 | $5,900 | $5,900 | $0 |
| 2018 | $881 | $38,700 | $10,800 | $27,900 |
| 2017 | $829 | $38,000 | $10,800 | $27,200 |
| 2016 | $848 | $38,000 | $10,800 | $27,200 |
| 2014 | $774 | $38,400 | $11,900 | $26,500 |
| 2013 | $774 | $38,100 | $11,900 | $26,200 |
Source: Public Records
Map
Nearby Homes
Your Personal Tour Guide
Ask me questions while you tour the home.