Estimated Value: $395,000 - $420,000
5
Beds
3
Baths
2,904
Sq Ft
$140/Sq Ft
Est. Value
About This Home
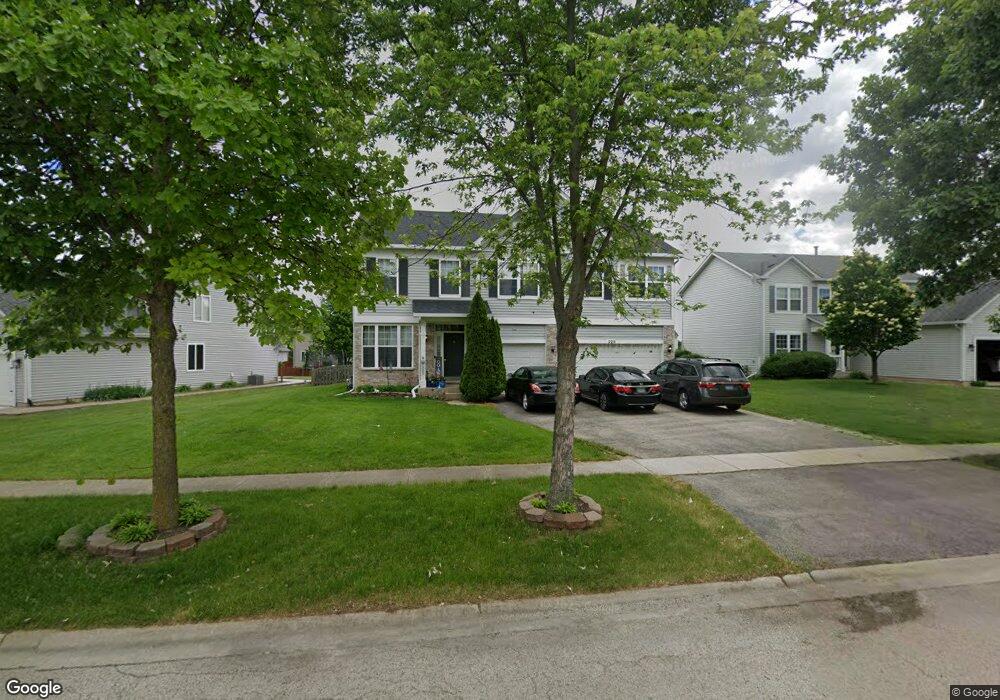
This home is located at 220 Schmidt St, Plano, IL 60545 and is currently estimated at $407,211, approximately $140 per square foot. 220 Schmidt St is a home located in Kendall County with nearby schools including P.H. Miller Elementary School, Emily G. Johns School, and Centennial Elementary School.
Ownership History
Date
Name
Owned For
Owner Type
Purchase Details
Closed on
Jun 5, 2017
Sold by
Muzzall David and Stalcup Janine
Bought by
Bonilla Hernan and Bonilla Leidarosa
Current Estimated Value
Home Financials for this Owner
Home Financials are based on the most recent Mortgage that was taken out on this home.
Original Mortgage
$204,212
Interest Rate
3.87%
Mortgage Type
FHA
Purchase Details
Closed on
Nov 7, 2016
Sold by
Tochimani Margarito
Bought by
Stalcup Janine and Muzzall David
Purchase Details
Closed on
Feb 15, 2006
Sold by
Lakewood Springs Llc
Bought by
Tochimani Margarito and Tochimani Hortencia
Home Financials for this Owner
Home Financials are based on the most recent Mortgage that was taken out on this home.
Original Mortgage
$240,100
Interest Rate
6.2%
Mortgage Type
Fannie Mae Freddie Mac
Create a Home Valuation Report for This Property
The Home Valuation Report is an in-depth analysis detailing your home's value as well as a comparison with similar homes in the area
Home Values in the Area
Average Home Value in this Area
Purchase History
| Date | Buyer | Sale Price | Title Company |
|---|---|---|---|
| Bonilla Hernan | $223,000 | Greater Metropolitan Title L | |
| Stalcup Janine | $130,000 | None Available | |
| Tochimani Margarito | $253,000 | None Available |
Source: Public Records
Mortgage History
| Date | Status | Borrower | Loan Amount |
|---|---|---|---|
| Previous Owner | Bonilla Hernan | $204,212 | |
| Previous Owner | Tochimani Margarito | $240,100 |
Source: Public Records
Tax History Compared to Growth
Tax History
| Year | Tax Paid | Tax Assessment Tax Assessment Total Assessment is a certain percentage of the fair market value that is determined by local assessors to be the total taxable value of land and additions on the property. | Land | Improvement |
|---|---|---|---|---|
| 2024 | $10,046 | $107,299 | $9,377 | $97,922 |
| 2023 | $9,279 | $95,436 | $8,340 | $87,096 |
| 2022 | $9,279 | $87,077 | $7,610 | $79,467 |
| 2021 | $8,886 | $81,694 | $7,140 | $74,554 |
| 2020 | $8,949 | $80,092 | $7,000 | $73,092 |
| 2019 | $8,871 | $77,676 | $6,713 | $70,963 |
| 2018 | $8,363 | $69,555 | $6,393 | $63,162 |
| 2017 | $8,182 | $63,813 | $6,393 | $57,420 |
| 2016 | $7,646 | $54,243 | $6,393 | $47,850 |
| 2015 | $6,894 | $43,530 | $5,250 | $38,280 |
| 2014 | -- | $40,776 | $5,000 | $35,776 |
| 2013 | -- | $37,893 | $7,322 | $30,571 |
Source: Public Records
Map
Nearby Homes
- 215 Alexis St
- 114 Schmidt Ct
- 3928 Kristen Ct
- 407 Keller St
- 706 Keller St
- 3616 Hoffman St
- 4310 Klatt St
- 4311 Cummins St
- 3839 Munson St Unit 7054
- 1397 Carolyn Ct
- 3736 Munson St Unit 7332
- 1341 Carolyn Ct
- 3742 Pope Ct Unit 7403
- 331 Gregory Ln
- 2813 Hoffman St
- 3305 Paige St Unit 2A
- 3707 Munson St
- 306 Waubonsee Dr
- 3119 Hoffman St
- Lot 11 Ashley Ln