
Landlord's Agent in 2021
Pamela Jessurum
Corcoran Classic Living
(954) 591-0455
130 Total Sales
Estimated Value: $331,000 - $349,000
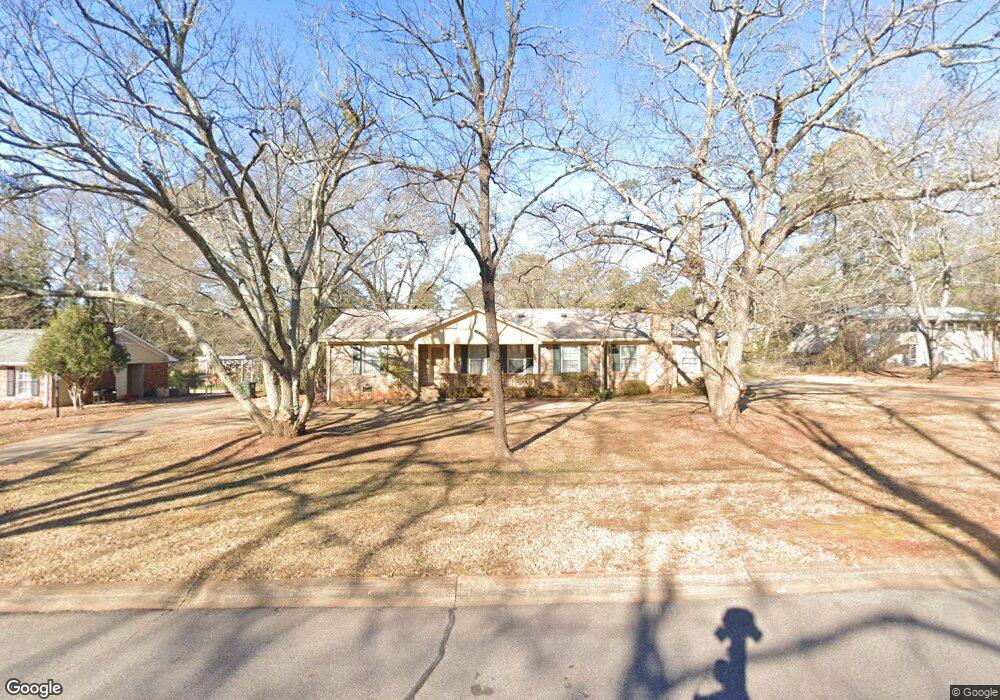
PRELEASING FOR FALL: Gorgeous family home for rent a block away from UGA's Vet School. This 3 bedroom 2 bath house has been meticulously maintained, freshly painted and ready for its new tenants. Beautiful natural hardwood floors throughout, a white kitchen, sunlights throughout, and an additional extra-large family room for extra space in this comfortable space. Separate carport and fenced-in backyard. Call Pamela @954-591-0455 for more info
Last Agent to Rent the Property
Corcoran Classic Living License #358974 Listed on: 05/05/2021
| Date | Buyer | Sale Price | Title Company |
|---|---|---|---|
| Osh Properties Llc | $180,000 | -- | |
| Fragaszy Richard J | $162,000 | -- | |
| Gess Peter L | $131,900 | -- | |
| Adamson Christopher P | -- | -- | |
| Adamson Christopher P | $120,000 | -- | |
| Odum Amanda Jane | $91,500 | -- | |
| Bowden Doris Jean | $77,500 | -- |
| Date | Status | Borrower | Loan Amount |
|---|---|---|---|
| Previous Owner | Fragaszy Richard J | $129,600 |
| Date | Event | Price | List to Sale | Price per Sq Ft |
|---|---|---|---|---|
| 05/05/2021 05/05/21 | Rented | -- | -- | -- |
| 05/05/2021 05/05/21 | For Rent | -- | -- | -- |
| Year | Tax Paid | Tax Assessment Tax Assessment Total Assessment is a certain percentage of the fair market value that is determined by local assessors to be the total taxable value of land and additions on the property. | Land | Improvement |
|---|---|---|---|---|
| 2025 | $3,843 | $123,768 | $12,000 | $111,768 |
| 2024 | $3,843 | $113,693 | $12,000 | $101,693 |
| 2023 | $3,553 | $106,405 | $12,000 | $94,405 |
| 2022 | $3,001 | $94,076 | $12,000 | $82,076 |
| 2021 | $2,426 | $75,822 | $12,000 | $63,822 |
| 2020 | $1,687 | $68,096 | $12,000 | $56,096 |
| 2019 | $1,662 | $65,263 | $12,000 | $53,263 |
| 2018 | $1,623 | $62,448 | $12,000 | $50,448 |
| 2017 | $1,492 | $53,936 | $12,000 | $41,936 |
| 2016 | $1,507 | $54,402 | $12,000 | $42,402 |
| 2015 | $1,516 | $54,564 | $12,000 | $42,564 |
| 2014 | $1,558 | $55,740 | $12,000 | $43,740 |
Landlord's Agent in 2021
Pamela Jessurum
Corcoran Classic Living
(954) 591-0455
130 Total Sales
Source: Savannah Multi-List Corporation
MLS Number: CM981340
APN: 182D1-A-014
Disclaimer: Certain information contained herein is derived from information provided by parties other than Homes.com. All information provided is deemed reliable, but is not guaranteed to be accurate and should be independently verified.
![]() IDX information is provided exclusively for personal, non-commercial use, and may not be used for any purpose other than to identify prospective properties consumers may be interested in purchasing.
IDX information is provided exclusively for personal, non-commercial use, and may not be used for any purpose other than to identify prospective properties consumers may be interested in purchasing.
Information is deemed reliable but not guaranteed.