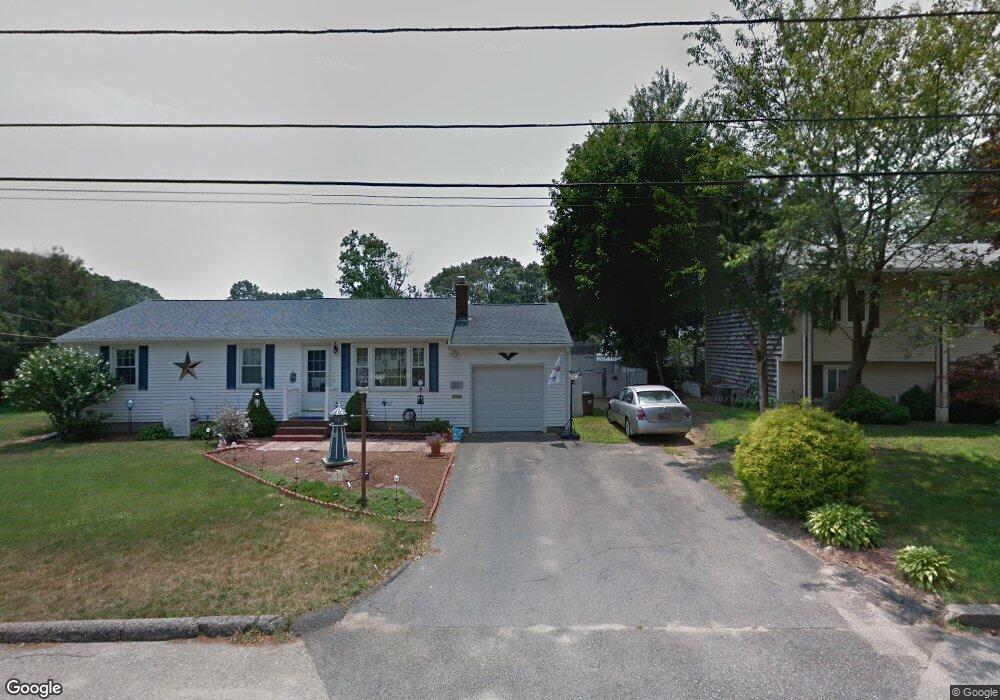
220 Smith St Warwick, RI 02886
Greenwood NeighborhoodEstimated Value: $389,960 - $424,000
3
Beds
1
Bath
1,092
Sq Ft
$375/Sq Ft
Est. Value
About This Home
This home is located at 220 Smith St, Warwick, RI 02886 and is currently estimated at $409,740, approximately $375 per square foot. 220 Smith St is a home located in Kent County with nearby schools including St Rose Of Lima School and Eleanor Briggs School.
Ownership History
Date
Name
Owned For
Owner Type
Purchase Details
Closed on
Mar 8, 2022
Sold by
Grossi Francesco J and Grossi Linda A
Bought by
Grossi Jessica A
Current Estimated Value
Purchase Details
Closed on
Nov 20, 2002
Sold by
Castaldi John E and Castaldi Brenda J
Bought by
Grossi Francesco J and Grossi Linda A
Home Financials for this Owner
Home Financials are based on the most recent Mortgage that was taken out on this home.
Original Mortgage
$110,000
Interest Rate
6.07%
Mortgage Type
Purchase Money Mortgage
Purchase Details
Closed on
Jan 28, 1994
Sold by
Linderson Paul E
Bought by
Castaldi John E and Castaldi Brenda
Home Financials for this Owner
Home Financials are based on the most recent Mortgage that was taken out on this home.
Original Mortgage
$100,322
Interest Rate
7.11%
Mortgage Type
Purchase Money Mortgage
Create a Home Valuation Report for This Property
The Home Valuation Report is an in-depth analysis detailing your home's value as well as a comparison with similar homes in the area
Home Values in the Area
Average Home Value in this Area
Purchase History
| Date | Buyer | Sale Price | Title Company |
|---|---|---|---|
| Grossi Jessica A | -- | None Available | |
| Grossi Francesco J | $158,500 | -- | |
| Castaldi John E | $100,000 | -- |
Source: Public Records
Mortgage History
| Date | Status | Borrower | Loan Amount |
|---|---|---|---|
| Previous Owner | Castaldi John E | $110,000 | |
| Previous Owner | Castaldi John E | $97,839 | |
| Previous Owner | Castaldi John E | $100,322 |
Source: Public Records
Tax History
| Year | Tax Paid | Tax Assessment Tax Assessment Total Assessment is a certain percentage of the fair market value that is determined by local assessors to be the total taxable value of land and additions on the property. | Land | Improvement |
|---|---|---|---|---|
| 2025 | $4,464 | $351,500 | $106,700 | $244,800 |
| 2024 | $4,273 | $295,300 | $88,200 | $207,100 |
| 2023 | $4,190 | $295,300 | $88,200 | $207,100 |
| 2022 | $4,061 | $216,800 | $62,600 | $154,200 |
| 2021 | $4,061 | $216,800 | $62,600 | $154,200 |
| 2020 | $4,061 | $216,800 | $62,600 | $154,200 |
| 2019 | $4,061 | $216,800 | $62,600 | $154,200 |
| 2018 | $3,463 | $166,500 | $61,600 | $104,900 |
| 2017 | $3,370 | $166,500 | $61,600 | $104,900 |
| 2016 | $3,370 | $166,500 | $61,600 | $104,900 |
| 2015 | $3,061 | $147,500 | $58,700 | $88,800 |
| 2014 | $2,959 | $147,500 | $58,700 | $88,800 |
| 2013 | $2,915 | $147,300 | $58,700 | $88,600 |
Source: Public Records
Map
Nearby Homes
- 157 George Arden Ave
- 5 Barre Ct
- 652 Main Ave
- 2907 Post Rd Unit 6
- 2907 Post Rd Unit 4
- 2907 Post Rd Unit 2
- 2907 Post Rd Unit 5
- 2907 Post Rd Unit 1
- 2907 Post Rd Unit 8
- 2907 Post Rd Unit 3
- 68 Packard Ave
- 74 Stephens Ave
- 233 Palace Ave
- 85 Gillan Ave
- 3524 W Shore Road Building C-704 Rd Unit C-704
- 3524 W Shore Rd Unit 215
- 207 Morse Ave
- 16 Arrow Ave
- 15 Link St
- 84 Spruce St
Your Personal Tour Guide
Ask me questions while you tour the home.