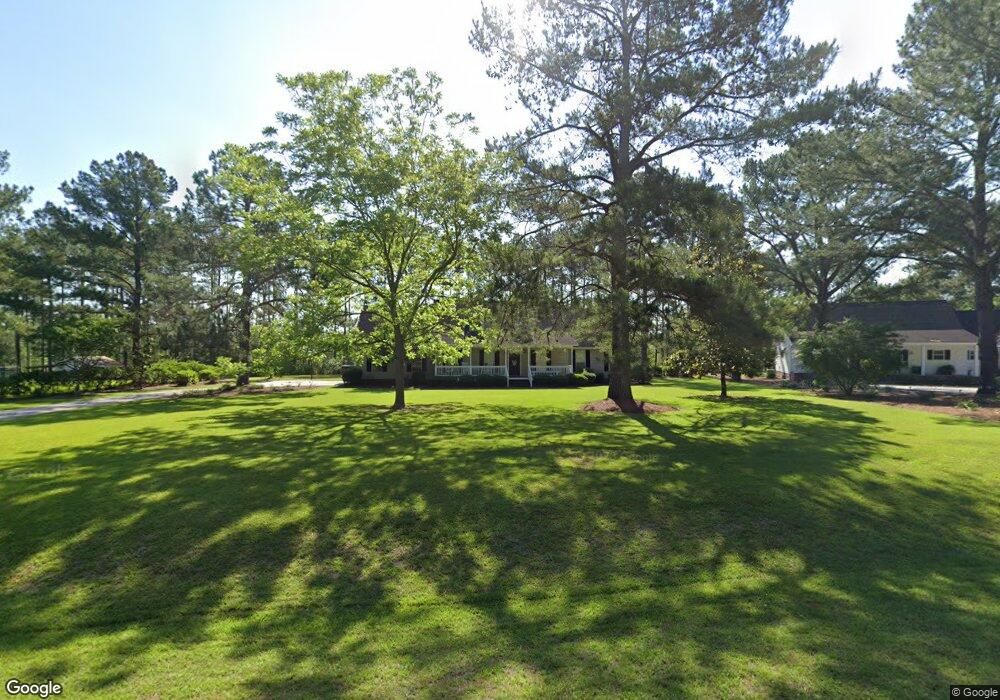
220 Southern Trail Moultrie, GA 31788
Estimated Value: $291,512 - $337,000
--
Bed
2
Baths
1,896
Sq Ft
$167/Sq Ft
Est. Value
About This Home
This home is located at 220 Southern Trail, Moultrie, GA 31788 and is currently estimated at $317,128, approximately $167 per square foot. 220 Southern Trail is a home located in Colquitt County with nearby schools including Sunset Elementary School, Willie J. Williams Middle School, and C.A. Gray Junior High School.
Ownership History
Date
Name
Owned For
Owner Type
Purchase Details
Closed on
Jul 22, 2024
Sold by
Smith Joshua
Bought by
Leon Erik Omar
Current Estimated Value
Home Financials for this Owner
Home Financials are based on the most recent Mortgage that was taken out on this home.
Original Mortgage
$256,500
Outstanding Balance
$204,256
Interest Rate
6.87%
Mortgage Type
New Conventional
Estimated Equity
$112,872
Purchase Details
Closed on
Dec 14, 2018
Sold by
Tucker Charles Edward
Bought by
Smith Joshua and Smith Haley
Home Financials for this Owner
Home Financials are based on the most recent Mortgage that was taken out on this home.
Original Mortgage
$174,775
Interest Rate
4.87%
Mortgage Type
FHA
Purchase Details
Closed on
Mar 13, 2001
Sold by
Burley P Francis
Bought by
Tucker Charles Edward
Purchase Details
Closed on
Sep 22, 2000
Bought by
Burley P Francis
Create a Home Valuation Report for This Property
The Home Valuation Report is an in-depth analysis detailing your home's value as well as a comparison with similar homes in the area
Home Values in the Area
Average Home Value in this Area
Purchase History
| Date | Buyer | Sale Price | Title Company |
|---|---|---|---|
| Leon Erik Omar | $285,000 | -- | |
| Smith Joshua | $178,000 | -- | |
| Tucker Charles Edward | $118,000 | -- | |
| Burley P Francis | $34,000 | -- |
Source: Public Records
Mortgage History
| Date | Status | Borrower | Loan Amount |
|---|---|---|---|
| Open | Leon Erik Omar | $256,500 | |
| Previous Owner | Smith Joshua | $174,775 |
Source: Public Records
Tax History Compared to Growth
Tax History
| Year | Tax Paid | Tax Assessment Tax Assessment Total Assessment is a certain percentage of the fair market value that is determined by local assessors to be the total taxable value of land and additions on the property. | Land | Improvement |
|---|---|---|---|---|
| 2024 | $2,138 | $101,370 | $13,008 | $88,362 |
| 2023 | $2,138 | $86,900 | $13,008 | $73,892 |
| 2022 | $2,004 | $84,182 | $13,008 | $71,174 |
| 2021 | $1,942 | $79,964 | $13,008 | $66,956 |
| 2020 | $1,780 | $72,020 | $13,008 | $59,012 |
| 2019 | $1,697 | $61,740 | $13,008 | $48,732 |
| 2018 | $1,575 | $61,568 | $13,008 | $48,560 |
| 2017 | $1,538 | $58,502 | $10,000 | $48,502 |
| 2016 | $1,558 | $58,502 | $10,000 | $48,502 |
| 2015 | $1,573 | $58,502 | $10,000 | $48,502 |
| 2014 | $1,543 | $58,502 | $10,000 | $48,502 |
| 2013 | -- | $58,501 | $10,000 | $48,501 |
Source: Public Records
Map
Nearby Homes
- 0 Old Timey Trail
- 240 Cheyenne Way
- 3222 Tallokas Rd
- 3240 Tallokas Rd
- 124 Flint Dr
- 125 Inner Cir
- 424 U S Highway 319
- 331 Cobblestone Blvd SE
- 12 Creekside Way SE
- 65 Packer Pride Dr SE
- 7 SE Pheasant Ln
- 0 26th Ave SE
- 1113 Georgia 133
- 33 Marys Ln
- 30 Marys Ln
- 5 Marys Ln SE
- 204 Nandina Dr
- 2016 4th St SE
- 64 Mcintosh Place SE
- 169 Quail Ridge
- 200 Southern Trail
- 226 Southern Trail
- 190 Southern Trail
- 188 Southern Trail
- 223 Southern Trail
- 171 Southern Trail
- 172 Southern Trail
- 169 Upper Trail
- 109 Southern Trail
- 158 Southern Trail
- 157 Upper Trail
- 151 Upper Trail
- 146 Southern Trail
- 120 Southern Trail
- 120 Friendship Trail
- 130 Upper Trail
- 105 Friendship Trail
- 140 Friendship Trail
- 111 Friendship Trail
- 150 Friendship Trail