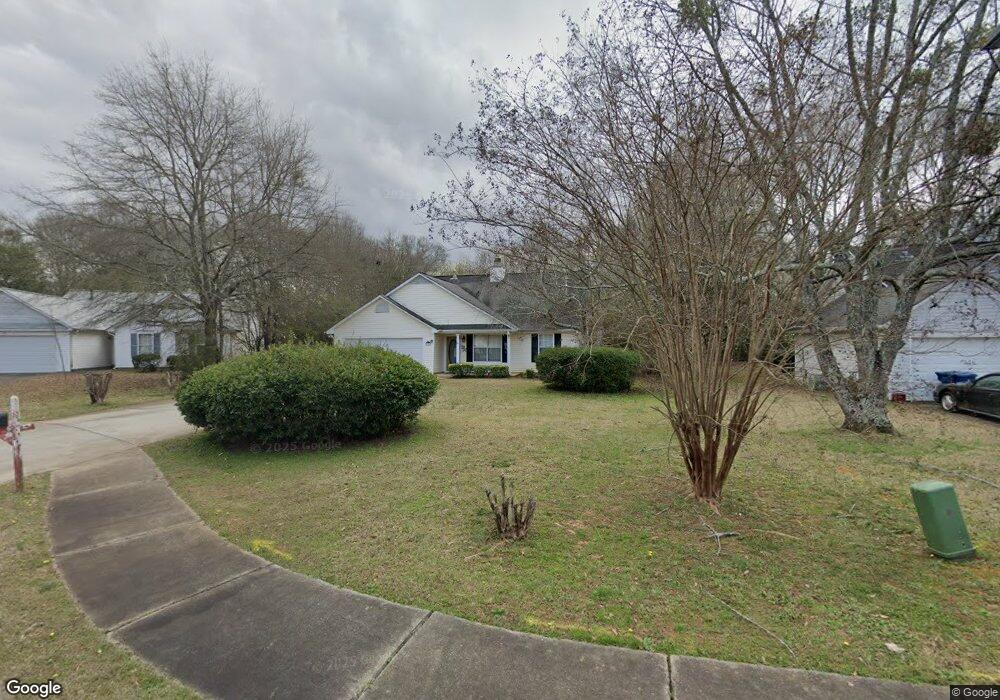
220 Talbot Ct McDonough, GA 30253
Estimated Value: $220,000 - $233,000
3
Beds
2
Baths
1,204
Sq Ft
$187/Sq Ft
Est. Value
About This Home
This home is located at 220 Talbot Ct, McDonough, GA 30253 and is currently estimated at $225,563, approximately $187 per square foot. 220 Talbot Ct is a home located in Henry County with nearby schools including Tussahaw Elementary School, McDonough Middle School, and McDonough Methodist Academy.
Ownership History
Date
Name
Owned For
Owner Type
Purchase Details
Closed on
Jan 10, 2012
Sold by
Bailey Marcia Y
Bought by
Bailey Marcia Y
Current Estimated Value
Purchase Details
Closed on
Jul 18, 2006
Sold by
Kinsey Richard
Bought by
Morris Owen
Purchase Details
Closed on
Dec 23, 1999
Sold by
Tim Jones Communities Inc
Bought by
Kinsey Richard
Home Financials for this Owner
Home Financials are based on the most recent Mortgage that was taken out on this home.
Original Mortgage
$96,200
Interest Rate
7.68%
Mortgage Type
VA
Create a Home Valuation Report for This Property
The Home Valuation Report is an in-depth analysis detailing your home's value as well as a comparison with similar homes in the area
Home Values in the Area
Average Home Value in this Area
Purchase History
| Date | Buyer | Sale Price | Title Company |
|---|---|---|---|
| Bailey Marcia Y | -- | -- | |
| Morris Owen | $107,000 | -- | |
| Kinsey Richard | $96,200 | -- |
Source: Public Records
Mortgage History
| Date | Status | Borrower | Loan Amount |
|---|---|---|---|
| Previous Owner | Kinsey Richard | $96,200 |
Source: Public Records
Tax History Compared to Growth
Tax History
| Year | Tax Paid | Tax Assessment Tax Assessment Total Assessment is a certain percentage of the fair market value that is determined by local assessors to be the total taxable value of land and additions on the property. | Land | Improvement |
|---|---|---|---|---|
| 2024 | $3,608 | $90,880 | $12,000 | $78,880 |
| 2023 | $3,592 | $95,640 | $11,200 | $84,440 |
| 2022 | $2,563 | $66,480 | $10,000 | $56,480 |
| 2021 | $2,036 | $51,560 | $10,000 | $41,560 |
| 2020 | $1,960 | $49,360 | $8,000 | $41,360 |
| 2019 | $1,966 | $48,120 | $8,000 | $40,120 |
| 2018 | $1,538 | $37,440 | $8,000 | $29,440 |
| 2016 | $1,420 | $34,120 | $6,000 | $28,120 |
| 2015 | $1,276 | $29,360 | $6,000 | $23,360 |
| 2014 | $1,023 | $23,800 | $6,000 | $17,800 |
Source: Public Records
Map
Nearby Homes
- 117 Tillman Ct
- 58 Washington St
- 34 Cherry St
- 309 Navigator Ln
- 313 Navigator Ln
- 38 Head St
- 317 Navigator Ln
- 133 Fairview Rd
- 357 Navigator Ln
- 329 Navigator Ln
- 61 Cherry St
- 349 Navigator Ln
- Annalise Plan at Avery Landing
- Dallas Plan at Avery Landing
- Braden Plan at Avery Landing
- 329 Hampton St
- 161 Carver Rd
- 210 Talbot Ct
- 230 Talbot Ct
- 200 Talbot Ct
- 240 Talbot Ct
- 0 Talbot Ct Unit 7047049
- 0 Talbot Ct Unit 8259492
- 0 Talbot Ct Unit 3210665
- 0 Talbot Ct
- 225 Talbot Ct
- 245 Talbot Ct
- 215 Talbot Ct
- 215 Talbot Ct
- 108 Tillman Ct
- 235 Talbot Ct
- 205 Talbot Ct
- 198 Phillips Dr
- 43 Washington St
- 208 Phillips Dr
- 49 Washington St
- 186 Phillips Dr