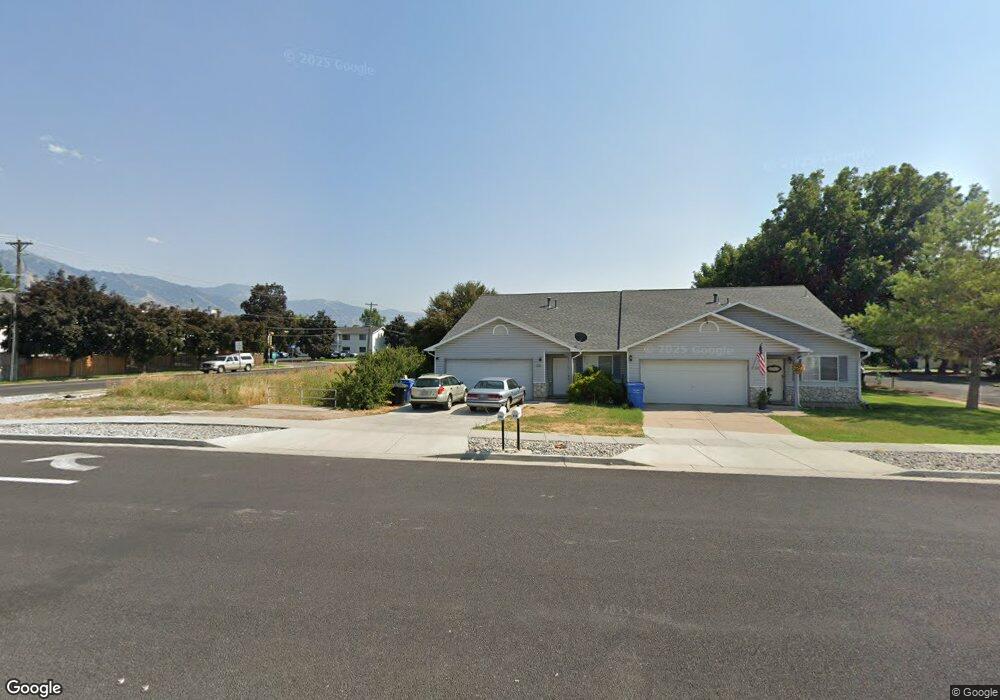
220 W 1200 N Logan, UT 84341
Bridger NeighborhoodEstimated Value: $336,000 - $556,000
3
Beds
2
Baths
1,698
Sq Ft
$239/Sq Ft
Est. Value
About This Home
This home is located at 220 W 1200 N, Logan, UT 84341 and is currently estimated at $405,452, approximately $238 per square foot. 220 W 1200 N is a home located in Cache County with nearby schools including Bridger School, Mount Logan Middle School, and Logan High School.
Ownership History
Date
Name
Owned For
Owner Type
Purchase Details
Closed on
Feb 7, 2022
Sold by
Twins Llc
Bought by
Twins Llc
Current Estimated Value
Purchase Details
Closed on
Sep 3, 2019
Sold by
Smith Amy Steele
Bought by
The Twins Llc
Home Financials for this Owner
Home Financials are based on the most recent Mortgage that was taken out on this home.
Original Mortgage
$1,736,000
Interest Rate
3.7%
Mortgage Type
Purchase Money Mortgage
Purchase Details
Closed on
Aug 27, 2019
Sold by
The Twins Llc
Bought by
Smith Peter and Smith Amy Steele
Home Financials for this Owner
Home Financials are based on the most recent Mortgage that was taken out on this home.
Original Mortgage
$1,736,000
Interest Rate
3.7%
Mortgage Type
Purchase Money Mortgage
Purchase Details
Closed on
Jun 16, 2005
Sold by
Steele Curtis W and Steele Catherine C
Bought by
The Twins Llc
Create a Home Valuation Report for This Property
The Home Valuation Report is an in-depth analysis detailing your home's value as well as a comparison with similar homes in the area
Home Values in the Area
Average Home Value in this Area
Purchase History
| Date | Buyer | Sale Price | Title Company |
|---|---|---|---|
| Twins Llc | -- | Cache Title | |
| The Twins Llc | -- | None Available | |
| Smith Peter | -- | None Available | |
| The Twins Llc | -- | South Eastern Utah Title Co |
Source: Public Records
Mortgage History
| Date | Status | Borrower | Loan Amount |
|---|---|---|---|
| Previous Owner | The Twins Llc | $1,736,000 | |
| Previous Owner | Smith Peter | $1,736,000 |
Source: Public Records
Tax History Compared to Growth
Tax History
| Year | Tax Paid | Tax Assessment Tax Assessment Total Assessment is a certain percentage of the fair market value that is determined by local assessors to be the total taxable value of land and additions on the property. | Land | Improvement |
|---|---|---|---|---|
| 2025 | $1,445 | $339,800 | $132,600 | $207,200 |
| 2024 | $1,492 | $339,800 | $132,600 | $207,200 |
| 2023 | $1,553 | $337,200 | $130,000 | $207,200 |
| 2022 | $2,500 | $506,800 | $135,000 | $371,800 |
| 2021 | $2,601 | $448,000 | $110,000 | $338,000 |
| 2020 | $1,647 | $255,300 | $75,000 | $180,300 |
| 2019 | $1,721 | $255,300 | $75,000 | $180,300 |
| 2018 | $1,808 | $244,860 | $55,000 | $189,860 |
| 2017 | $1,633 | $116,930 | $0 | $0 |
| 2016 | $1,693 | $116,930 | $0 | $0 |
| 2015 | $1,695 | $116,930 | $0 | $0 |
| 2014 | $1,532 | $116,930 | $0 | $0 |
| 2013 | -- | $114,065 | $0 | $0 |
Source: Public Records
Map
Nearby Homes
- 2200 N 220 W
- 1030 N 130 W Unit 100
- 897 N 250 W
- 894 N 400 W
- 559 W 1350 N Unit 41
- 1515 N 450 W Unit 103
- 873 N 480 W
- 514 W 1490 N Unit 102
- 539 W 1465 N Unit 17-102
- 430 W 810 N
- 1492 N 565 W Unit 101
- 420 W 750 N
- 446 W 1595 N Unit 103
- 223 W 730 N
- 243 W 730 N
- 190 W 700 N
- 227 W 690 N
- 20 Kings Ct
- 345 W 690 N
- 365 W 690 N